| Dahm JB et al. |
|---|
Doppler Echocardiography in Dilated Cardiomyopathy: Diastolic and Combined Systolic/Diastolic Parameters Offer More Detailed Information on Left Ventricular Global Dysfunction than Systolic Parameters
Journal of Clinical and Basic Cardiology 2002; 5 (2): 189-192
PDF Summary Figures
| Figure |
|---|
| |
|
|
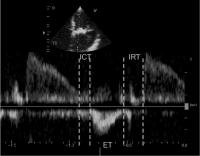
Systolisch/diastolische Performance
Figure 1: Calculation of the systolic/diastolic performance
[(ICT+IRT)/ET]: Mitral closure-to-opening interval (a) is characterized as the time from cessation to the beginning of mitral inflow. Ejection time (ET) is measured as the duration of left ventricular outflow (b). Isovolumetric contraction time (ICT) + isovolumetric relaxation time (IRT) is calculated by subtracting "b" from "a" divided by "b" [(ICT+IRT)/ET = (a–b)/b].
Keywords: diastole,
diastole,
Echocardiographa,
Echokardiographie,
Systole,
Systole
|
| |
| |
|
|
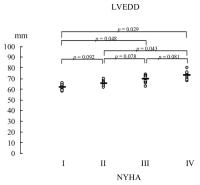
LVEDD
Figure 2: Left ventricular enddiastolic diameter (LVEDD) measurements obtained by echocardiography of the 68 patients in the different NYHA-groups.
Keywords: Diagramm,
Diameter,
Durchmesser,
echocardiography,
Echokardiographie,
LVEDD,
LVEDD,
NYHA,
NYHA
|
| |
| |
|
|
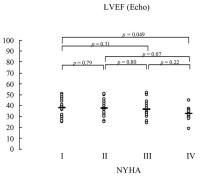
LVEF
Figure 3: Left ventricular ejection fraction (LV-EF) obtained by
echocardiography (Simpson’s method) of the 68 patients in the different NYHA-groups.
Keywords: Auswurffraktion,
Diagramm,
echocardiography,
Echokardiographie,
Ejection fraction,
Ejektion,
LVEF,
NYHA,
NYHA,
Simpson,
Simpson,
ventricle,
Ventrikel
|
| |
| |
|
|
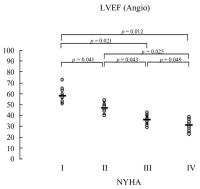
LVEF
Figure 4: Left ventricular ejection fraction (LV-EF) obtained by angiography of the 68 patients in the different NYHA-groups.
Keywords: Angiographie,
angiography,
Auswurffraktion,
Ejection fraction,
Ejektion,
NYHA,
NYHA,
ventricle,
Ventrikel
|
| |
| |
|
|
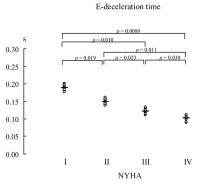
E-Dezelerationszeit
Figure 5: E-deceleration time of the 68 patients in the different NYHA-groups.
Keywords: Diagramm,
E-deceleration time,
E-Dezeleration,
NYHA,
NYHA
|
| |
| |
|
|
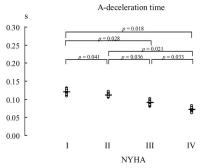
A-Dezelerationszeit
Figure 6: A-deceleration time of the 68 patients in the different NYHA-groups.
Keywords: A-deceleration time,
A-Dezeleration,
Diagramm,
NYHA,
NYHA
|
| |
| |
|
|
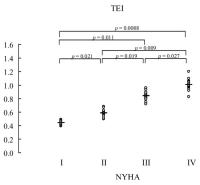
Systolisch/diastolische Performance
Figure 7: The systolic/diastolic performance (Tei-index) of the 68 patients in the different NYHA-groups
Keywords: Diagramm,
diastole,
diastole,
NYHA,
NYHA,
Performance,
Systole,
Systole,
TEI-Index,
TEI-Index
|
| |
| |
|
|

