| |
|---|
Jahrestagung der Österreichischen Gesellschaft für Rheumatologie & Rehabilitation
28. - 30. November 2013
Abstracts der Posterpräsentationen
Journal für Mineralstoffwechsel & Muskuloskelettale Erkrankungen 2013; 20 (4): 141-165
Volltext (PDF) Abbildungen
| Abbildung |
|---|
| |
|
|
ÖGR-Jahrestagung 2013
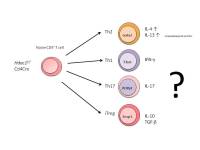
Abbildung 1: Goeschl L, et al. Molecular analysis of HDAC1 function in TH17 T cells.
Keywords: HDAC1,
Mineralstoffwechsel,
Molekularanalyse,
Schema
|
| |
| |
|
|
ÖGR-Jahrestagung 2013
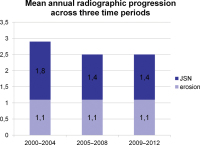
Abbildung 2: Gärtner M, et al. Patients with radiographic progression (n = 406) during 3 time periods. The figure shows the mean annual radiographic progression rates for total SvdH Score, erosions, as well as JSN. There was no significant difference between the different time periods.
Keywords: Diagramm,
Mineralstoffwechsel,
Rheumatoide Arthritis
|
| |
| |
|
|
ÖGR-Jahrestagung 2013
Abbildung 3: Kocijan R, et al. Trabekulärer Knochenstrukturdefekt bei Patienten mit milder OI-I, schwerer OI-III und moderater OI-IV, verglichen mit einer gesunden Kontrollperson (CO). HR-pQCT-Scan des Radius, axiale Schnitte.
Keywords: CT,
HR-pQCT,
Knochenstrukturdefekt,
Mineralstoffwechsel,
Osteogenesis imperfecta
|
| |
| |
|
|
ÖGR-Jahrestagung 2013
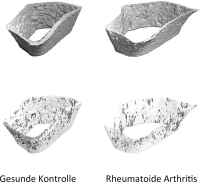
Abbildung 4: Kocijan R, et al. Kortikale Ausdünnung bei unauffälliger kortikaler Porosität bei einer Patientin mit rheumatoider Arthritis bzw. einer gesunden Kontrollperson. HR-pQCT-Scan des distalen Radius, 3-D-Rekonstruktion der Kortikalis.
Keywords: 3D-Rekonstruktion,
CT,
HR-pQCT,
Mineralstoffwechsel,
Rheumatoide Arthritis
|
| |
| |
|
|
ÖGR-Jahrestagung 2013
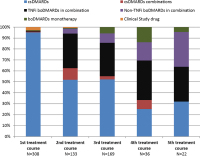
Abbildung 5: Studenic P, et al. Proportion of patients treated with conventional synthetic (cs) DMARDSs, combination treatment of csDMARDs with either tumour-necrosis factor inhibitors (TNFi) or non-TNFi-biological originator (bo) DMARDS, and monotherapy with boDMARDs, for each sequential treatment course in percent.
Keywords: Diagramm,
Mineralstoffwechsel,
Rheumatoide Arthritis
|
| |
| |
|
|
ÖGR-Jahrestagung 2013
Abbildung 6: Studenic P, et al. Smallest detectable differences (SDD) between day 1 and consecutive 27 days. Blue lines show development of SDD for pain, the red line for patient global assessment, and the green line for fatigue.
Keywords: Diagramm,
Mineralstoffwechsel,
Rheumatoide Arthritis
|
| |
| |
|
|
ÖGR-Jahrestagung 2013
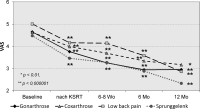
Abbildung 7: Stritzinger B, et al. Kernspinresonanz bei Arthrosen - Belastungsschmerz.
Keywords: Arthrose,
Diagramm,
Kernspinresonanz,
Mineralstoffwechsel
|
| |
| |
|
|
ÖGR-Jahrestagung 2013
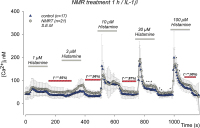
Abbildung 8: Steinecker-Frohnwieser B, et al. NMRT influences the intracellular calcium signalling by induced augmentation of basal calcium.
Keywords: Diagramm,
Kalzium,
Kernspinresonanz,
Mineralstoffwechsel
|
| |
| |
|
|

