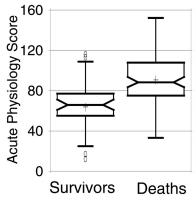
Acute Physiology Score
Figure 1: Acute Physiology Scores (APS) in patients after cardiac arrest (hospital survivors and deaths) are displayed by medians of box-and-whisker plots. The data were calculated on the day of admission to the intensive care unit. The plots divide data into 4 areas of equal frequency. The box encloses the middle 50 %. The median is drawn as a horizontal line inside the box (median notch). Two vertical lines extending from each end of the box represent
data distribution from the first and third quartile to the smallest and largest data points within 1.5 interquartile ranges. Far outliers (data points more than 3 interquartile ranges below the first or above the third quartile) are displayed as circles. The location of sample means is indicated by asterisks.
Keywords:
Acute Physiology Score,
Acute Physiology Score,
cardiac arrest,
death,
Diagramm,
Herzstillstand,
Survivers,
Tod,
Überleben

