| Inoue J et al. |
|---|
Left Atrial Ejection Force (LAEF) in Patients With Hypertension: LAEF Is Decreased in Hypertensive Patients With Left Ventricular Failure Or Atrial Fibrillation
Journal of Clinical and Basic Cardiology 2002; 5 (3): 237-240
PDF Summary Figures
| Figure |
|---|
| |
|
|
LAEF (Left Atrial Ejection Force)
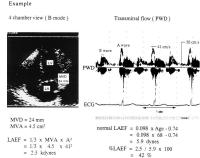
Figure 1: The method for calculating the left atrial ejection force. Left panel shows the schema of four chamber view on twodimensional echocardiogram. As shown by arrow, mitral valve dimension (MVD)
was measured, and mitral valve area (MVA) was calculated as a circle. Right panel shows the schema of transmitral flow velocity on the pulsed wave Doppler (PWD). Left atrial ejection force (LAEF) was calculated using the final equation.
Keywords: Atrium,
Auswurf,
echocardiography,
Echokardiographie,
Ejektion,
LAEF,
LAEF,
left atrial ejection force
|
| |
| |
|
|
LAEF (left atrial ejection force) - Alter
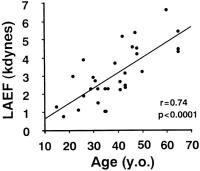
Figure 2: Relationship between LAEF and age in normal subjects. LAEF positively correlated with age. R-value was 0.74 (p < 0.0001), and regression line was LAEF = 0.098 x age – 0.74.
Keywords: AGE,
Alter,
Atrium,
Diagramm,
Ejektion,
LAEF,
LAEF,
left atrial ejection force
|
| |
| |
|
|
LAEF (left atrial ejection force) - Herzmasse
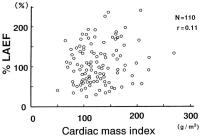
Figure 3: Relationship between cardiac mass index and %LAEF in hypertensive patients. Cardic mass index ranged from 50 to 270 g/m2. There were no significant correlations between two parameters
(r = 0.11, n.s.).
Keywords: Atrium,
Cardiac mass,
Diagramm,
Ejektion,
Herzmasse,
LAEF,
LAEF,
left atrial ejection force
|
| |
| |
|
|
LAEF (left atrial ejection force) - Linksatrialer Durchmesser
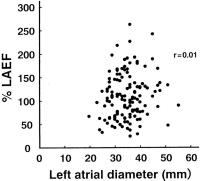
Figure 4: Relationship between left atrial diameter and %LAEF in hypertensive patients. Left atrial diameter ranged from 20 to 55 mm. There were no significant correlations between two parameters
(r = 0.01, n.s.).
Keywords: Atrium,
Diagramm,
Diameter,
Durchmesser,
Ejektion,
LAEF,
LAEF,
left atrial ejection force
|
| |
| |
|
|
LAEF (left atrial ejection force) - WHO-Klassifikation
Figure 5: Relationship between WHO stage and %LAEF. %LAEF was 107.8 % in WHO stage I, 111.6 % in stage II and 105.7 % in stage III (on average). %LAEF was slightly higher in stage II than in
stage I, however, there were no statistically significant differences among the three groups.
Keywords: Atrium,
classification,
Diagramm,
Ejektion,
Klassifikation,
LAEF,
LAEF,
left atrial ejection force,
Stage,
WHO,
WHO
|
| |
| |
|
|
LAEF (left atrial ejection force) - Hypertonie
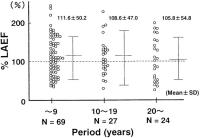
Figure 6: Relationship between period of hypertension and %LAEF. %LAEF was 111.6 % in period less than 9 years, 108.6 % in 10 through 19 years and 105.8 % in over 20 years (on average). %LAEF had a tendency to decrease with period of hypertension,
however, there were no statistically significant differences among the three groups (n.s.).
Keywords: Atrium,
Diagramm,
Ejektion,
hypertension,
Hypertonie,
LAEF,
LAEF,
left atrial ejection force
|
| |
| |
|
|
LAEF (left atrial ejection force) - Hypertonie
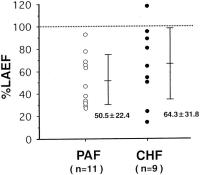
Figure 7: %LAEF in hypertensive patients with paroxysmal atrial fibrillation (PAF) or congestive heart failure (CHF). %LAEF of 6-12 months before CHF or PAF are shown. %LAEF was significantly lower in patients with PAF than in those without PAF. %LAEF was significantly lower in patients with CHF than those without CHF.
Keywords: atrial fibrillation,
Atrium,
Diagramm,
Ejektion,
heart failure,
Herzinsuffizienz,
hypertension,
Hypertonie,
LAEF,
LAEF,
left atrial ejection force,
PAF,
Vorhofflimmern
|
| |
| |
|
|

