Krause und Pachernegg
Verlag für Medizin und Wirtschaft
Artikel   Bilder   Volltext

Mobile Version
A-  |   A  |   A+
Werbung
 
Abbildungen und Graphiken
 
Kardiologie im Zentrum
Fortbildung der Klinik für Kardiologie und Internistische Intensivmedizin, Kepler Universitätsklinikum Linz
5.–6. Oktober 2018, Design Center Linz
Abstracts


Journal für Kardiologie - Austrian Journal of Cardiology 2018; 25 (11-12): 350-351

Volltext (PDF)    Abbildungen   


Abbildung
 
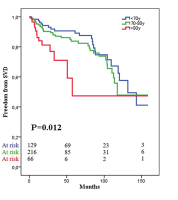
Kaplan-Meier plot
Abbildung 1: C. Nitsche et al. Kaplan-Meier plot. Freedom from structural valve degeneration according to age. SVD indicates structural valve degeneration; y, years;


Keywords: Kaplan-Meier plotKardiologie
 
 
COPD
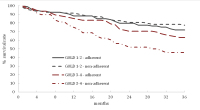
Abbildung 2: A. Horner, et al.


Keywords: COPDKardiologie
 
 
CRYO
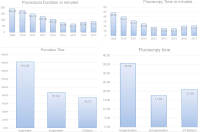
Abbildung 3: A. Nahler, et al.


Keywords: CRYOKardiologie
 
 
HFpEF
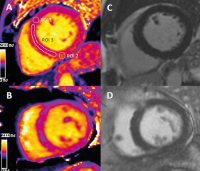
Abbildung 4: C. Nitsche et al. Panels A and B show precontrast T1 mapping images of 2 HFpEF patients. ROI indicates “region of interest” and demonstrates assessment of RVIPs (ROI 1 and 2 for anterior and inferior RVIP, respectively) and the IVS (ROI 3). Panels C and D show corresponding LGE images. No LGE can be detected in panel C, whereas panel D shows clear LGE in both RVIPs.


Keywords: HFpEFKardiologie


copyright © 2000–2025 Krause & Pachernegg GmbH | Sitemap | Datenschutz | Impressum
 
Werbung