Krause und Pachernegg
Verlag für Medizin und Wirtschaft
Artikel   Bilder   Volltext

Mobile Version
A-  |   A  |   A+
Werbung
 
Abbildungen und Graphiken
Mühlberger V et al.  
Herzkathetereingriffsdaten im COVID-Pandemiejahr 2020 im Vergleich zu 2019 aus dem österreichischen ANCALAR-Register // Data on Cardiac Catheterization during the COVID Pandemic-Year 2020 in Relation to Year 2019 (Austrian ANCALAR-Registry)

Journal für Kardiologie - Austrian Journal of Cardiology 2021; 28 (5-6): 166-172

Volltext (PDF)    Summary    Abbildungen   


Abbildung
 
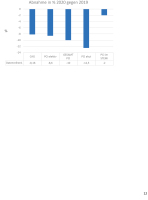
Herzkatheter-Zahlen
Abbildung 1: Vergleich ausgewählter Herzkatheter-Zahlen 2020 versus 2019.
Figure 1. Percentage of reduction in coronary angiography (CAG), elective PCI, total PCI, acute PCI and PCI for STEMI. Comparing full year 2020 to full year 2019 in n = 12 Austrian CathLabs.


Keywords: DiagrammHerzkatheterKardiologie
 
 
PCI-Techniken
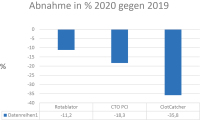
Abbildung 2: Vergleich spezieller PCI-Techniken 2020 versus 2019.
Figure 2. Percentage of reduction in PCI with rotablator, PCI for chronic total occlusion and PCI using clot catcher. Comparing full year 2020 to full year 2019 in n = 12 Austrian CathLabs.


Keywords: DiagrammKardiologiePCI
 
 
Diagnostische Techniken
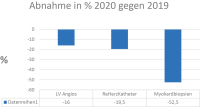
Abbildung 3: Vergleich spezieller diagnostischer Techniken 2020 versus 2019.
Figure 3. Percentage of reduction in left ventricular angiography, right heart Catheterization and myocardial biopsies. Comparing full year 2020 to full year 2019 in n = 12 Austrian CathLabs


Keywords: DiagnostikDiagrammKardiologie
 
 
Elektrophysiologische Zahlen
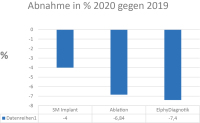
Abbildung 4: Vergleich elektrophysiologischer Zahlen 2020 versus 2019
Figure 4. Percentage of reduction in pacemaker implantations, electrophysiologic ablation and diagnostics. Comparing full year 2020 to full year 2019 in n = 12 Austrian CathLabs.


Keywords: DiagrammElektrophysiologische ZahlenKardiologie
 
 
Therapie
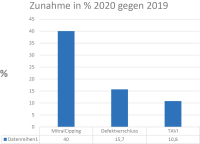
Abbildung 5: Vergleich therapeutischer Eingriffe bei struktureller Herzkrankheit 2020 versus 2019.
Figure 5. Percentage of increase in MitralClipping, defect closure and trans arterial valve implantation. Comparing full year 2020 to full year 2019 in n = 12 Austrian CathLabs.


Keywords: DiagrammKardiologieTherapeutischer Eingriff
 
 
PCI - CAG
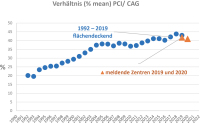
Abbildung 6: Verhältnis PCI / CAG 1992–2019 in Österreich flächendeckend [7] und im Jahr 2019 und 2020 für n = 12 identische Zentren berechnet.
Figure 6. Percentage of PCI per coronary angiography (PCI/CAG) nationwide [7] during 1992–2019 and comparing full year 2020 to full year 2019 in n = 12 Austrian CathLabs.


Keywords: CAGDiagrammKardiologiePCI
 
 
STEMI - PCI
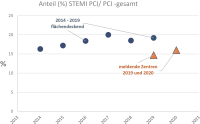
Abbildung 7: Verhältnis STEMI-PCI/Gesamt-PCI in den Jahren 2014–2019 in Österreich flächendeckend [7] und im Jahr 2019 und 2020 für n = 12 identische Zentren berechnet. Figure 7. Percentage of STEMI PCI per total PCI (%) nationwide (7) during 2014–2019 and comparing full year 2020 to full year 2019 in n = 12 Austrian CathLabs.


Keywords: DiagrammKardiologiePCISTEMI


copyright © 2000–2025 Krause & Pachernegg GmbH | Sitemap | Datenschutz | Impressum
 
Werbung