| Lörincz I et al. | ||||||||||||||||
|---|---|---|---|---|---|---|---|---|---|---|---|---|---|---|---|---|
|
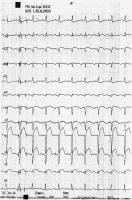
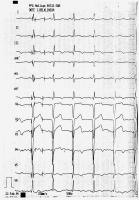
Reduced QT dispersion after early thrombolysis - protection of ventricular electrical stability
Journal of Clinical and Basic Cardiology 1999; 2 (1): 85-88 PDF Summary Figures
|
||||||||||||||||

Verlag für Medizin und Wirtschaft |
|
||||||||
|
Figures and Graphics
|
|||||||||
| copyright © 2000–2025 Krause & Pachernegg GmbH | Sitemap | Datenschutz | Impressum | |||||||||
|
|||||||||

