Krause und Pachernegg
Verlag für Medizin und Wirtschaft
Artikel   Bilder   Volltext

Mobile Version
A-  |   A  |   A+
Werbung
 
Abbildungen und Graphiken
Viidik A  
Can Biological Ageing be modulated?

Journal für Urologie und Urogynäkologie 2004; 11 (Sonderheft 5) (Ausgabe für Österreich): 18-19

Volltext (PDF)    Abbildungen   


Abbildung
 
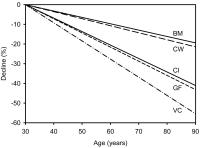
Alter - Physiologische Funktionen
Abbildung 1: Age changes in basal metabolic rate (BM), amount of intracellular water (CW), cardiac index (CI), glomerular filtration (GF) and vital capacity (VC). The value at the age of 30 years is set to 100 %. Regression lines were calculated using data from Shock NW, 1962.


Keywords: AlterDiagrammPhysiologieUrologie
 
 
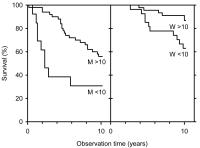
Physikalische Aktivität - Alter
Abbildung 2: Survival of 60–69 year old men (M) and (W) over a 10 year observation period divided into those being physically active corresponding to more than (> 10) and less than (< 10) 10 km of brisk walking per week. Data from Heikkinen E et al., 1993.


Keywords: DiagrammUrologieÜberlebenälterer Mann


copyright © 2000–2025 Krause & Pachernegg GmbH | Sitemap | Datenschutz | Impressum
 
Werbung