Krause und Pachernegg
Verlag für Medizin und Wirtschaft
Artikel   Bilder   Volltext

Mobile Version
A-  |   A  |   A+
Werbung
 
Figures and Graphics
de la Sierra A  
Effects of Eprosartan on Pulse Pressure

Journal of Clinical and Basic Cardiology 2005; 8 (1-4): 11-14
Journal of Clinical and Basic Cardiology 2006; 9 (Sonderheft 1): 9-12

PDF    Summary    Figures   


Figure
 
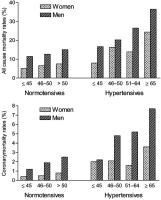
All-cause mortality - coronary mortality
Figure 1: All-cause mortality (top) and coronary mortality (bottom) in normotensive and hypertensive men and women depending on pulse pressure categories; data obtained from [8].


Keywords: all cause mortalitycoronary mortalitydiagramDiagrammGesamtmortalitäthypertensionHypertonieKoronarmortalität
 
 
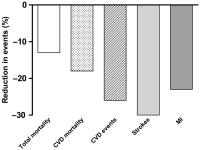
Morbidity - Mortality
Figure 2: Reduction in morbidity and mortality by antihypertensive treatment in patients with isolated systolic hypertension. Metaanalysis from randomised trials; data from [24]


Keywords: diagramDiagrammhypertensionHypertoniemorbidityMorbiditätmortalityMortalität
 
 
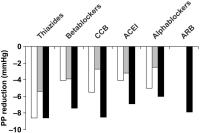
Pulse pressure
Figure 3: Reduction in pulse pressure by different antihypertensive drug classes in three different comparative trials. Open bars represent data from [27], light grey bars represent data from [28], solid bars represent data from [29]. CCB = calcium channel blockers; ACEI = angiotensin-converting enzyme inhibitors; ARB = angiotensin- receptor blockers.


Keywords: diagramDiagrammhypertensionHypertoniePulsdruckpulse pressure
 
 
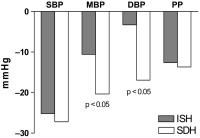
Eprosartan - blood pressure
Figure 4: Effects of eprosartan on different blood pressure components in patients with isolated systolic hypertension (ISH) or systodiastolic hypertension (SDH). In patients with ISH the effect on systolic (SBP) and pulse pressure (PP) is maintained, whereas the effect on diastolic (DBP) and mean (MBP) pressures is clearly less pronounced.


Keywords: blood pressureBlutdruckdiagramDiagrammhypertensionHypertonie


copyright © 2000–2025 Krause & Pachernegg GmbH | Sitemap | Datenschutz | Impressum
 
Werbung