Krause und Pachernegg
Verlag für Medizin und Wirtschaft
Artikel   Bilder   Volltext

Mobile Version
A-  |   A  |   A+
Werbung
 
Figures and Graphics
Gasser R et al.  
Letters to the editor: Effects of Nebivolol on Myocardial Gene Expression during N2-stimulated Ischemia in Human Atrial Myocardium

Journal of Clinical and Basic Cardiology 2006; 9 (1-4): 42-44

PDF    Figures   


Figure
 
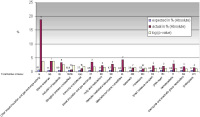
Myocardial cellular gene expression
Figure 1: Myocardial cellular gene expression significantly down-regulated during experimental ischemia under nebivolol compared to control-ischemia experiments without nebivolol. Yellow bars indicate significance expressed as log p-value: left – highest significance.


Keywords: diagramDiagrammgene expressionGenexpression
 
 
Myocardial cellular gene expression
Figure 2: Myocardial cellular gene-expression significantly up-regulated during experimental ischemia under nebivolol compared to control-ischemia experiments without nebivolol. Yellow bars indicate significance expressed as log p-value: left – highest significance.


Keywords: diagramDiagrammgene expressionGenexpression
 
 
Gene de-regulation
Figure 3: Graphic display of gene de-regulation in myocardial ischemia under nebivolol compared to ischemia under control conditions. One can clearly see a distinct difference between treatment (right side of each penal) and no-treatment (left side of each penal). Red: genes downregulated under nebivolol, green: genes up-regulated under nebivolol.


Keywords: Genderegulationgene de-regulationSchemascheme


copyright © 2000–2025 Krause & Pachernegg GmbH | Sitemap | Datenschutz | Impressum
 
Werbung