Verlag für Medizin und Wirtschaft
Artikel
Bilder
Volltext
Mobile Version
A-
|
A
|
A+
Werbung
Abo
Bestellung Jahresabonnement (Print/elektronisch)
Bestellung kostenloses e-Journal-Abo
Mediadaten
Journale
News
Datenbanken
Suche Medizinische Publikationen
Suche Abbildungen und Grafiken
Medizinprodukte - Labortechnik
Antidotarium (Stand 2012)
Phytokodex (Stand 2012)
Endoskopie in Österreich (Stand 2010)
Kardiologie in Österreich (Stand 2006)
Osteologie in Österreich (Stand 2016)
Fortbildung
Bücher
Fachbücher
Patientenliteratur
Impressum
Offenlegung
Kontakt
Disclaimers & Copyright
Allgemeine Geschäftsbedingungen
Datenschutzerklärung
Sitemap
Figures and Graphics
Haczynski J et al.
Effect of moxonidine on left ventricular hypertrophy in hypertensive patients
Journal of Clinical and Basic Cardiology 2001; 4 (1)
: 61-65
PDF
Summary
Figures
Figure
Maximize View
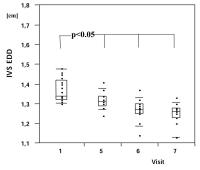
Moxonidin - enddiastolischer Durchmesser
Figure 1: Interventricular septum end-diastolic diameter (IVS EDD) at baseline (visit 1) and after 3 month (visit 5), 6 month (visit 6) and 9 months (visit 7) moxonidine monotherapy.
Keywords:
Diagramm
,
end-diastolic diameter
,
Enddiastolischer Durchmesser
,
interventricular septum
,
Interventrikuläres Septum
,
Moxonidin
,
moxonidine
Maximize View
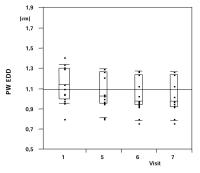
Moxonidin - enddiastolischer Durchmesser
Figure 2: Left ventricular posterior wall end-diastolic diameter (PW EDD) at baseline (visit 1) and after 3 month (visit 5), 6 month (visit 6) and 9 month (visit 7) moxonidine monotherapy
Keywords:
Diagramm
,
end-diastolic diameter
,
Enddiastolischer Durchmesser
,
left ventricular posterior wall
,
linksventrikuläre Hinterwand
,
Moxonidin
,
moxonidine
Maximize View
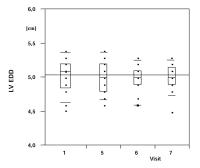
Moxonidin - enddiastolischer Durchmesser
Figure 3: Left ventricular end-diastolic diameter (LV EDD) at baseline (visit 1) and after 3 month (visit 5), 6 month (visit 6) and 9 month (visit 7) moxonidine monotherapy.
Keywords:
Diagramm
,
left ventricular end-diastolid diameter
,
linksventrikulärer enddiastolischer Durchmesser
,
Moxonidin
,
moxonidine
Maximize View
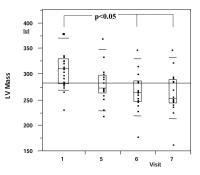
Moxonidin - linksventrikuläre Masse
Figure 4: Left ventricular (LV) mass at baseline (visit 1) and after 3 month (visit 5), 6 month (visit 6) and 9 month (visit 7) moxonidine monotherapy.
Keywords:
Diagramm
,
left ventricular mass
,
linksventrikuläre Masse
,
Moxonidin
,
moxonidine
copyright © 2000–2025
Krause & Pachernegg GmbH
|
Sitemap
|
Datenschutz
|
Impressum
Werbung