Krause und Pachernegg
Verlag für Medizin und Wirtschaft
Artikel   Bilder   Volltext

Mobile Version
A-  |   A  |   A+
Werbung
 
Figures and Graphics
Malendowicz SL et al.  
The 1166A/C polymorphism of the angiotensin II type 1 receptor gene does not correlate with the blood pressure response to angiotensin II in patients with CHF

Journal of Clinical and Basic Cardiology 2001; 4 (1): 75-77

PDF    Summary    Figures   


Figure
 
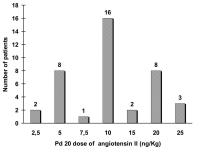
Angiotensin II - Dosierung
Figure 1: Pd 20 dose of Angiotensin II ng/kg varied from 2.5 to 25 ng/kg (median of 10 ng/kg) thorough the patients population. Graph represents the number of patients in each group of effective dose of Angiotensin II (Pd20) (ng/kg).


Keywords: Angiotensin IIAngiotensin IIDiagrammdosageDosierung
 
 
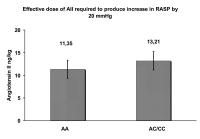
Angiotensin II - Dosierung
Figure 2: Effective dose of Angiotensin II (AII) (ng/kg) (Pd 20) required to produce increase in Radial Artery Systolic Pressure (RASP) by 20 mmg/Hg was similar in patients with AA and AC/CC polymorphism of AT1 receptor gene. Graph represents the AII Pd 20 in patients with AA and AC/CC polymorphism of AT1 receptor gene 11.35 +/- 1.18 vs 13.21 +/- 2.2 respectively (p = 0.42).


Keywords: Angiotensin IIAngiotensin IIArteria radialisArteria radialisblood pressureBlutdruckDiagrammdosageDosierungSystoleSystole
 
 
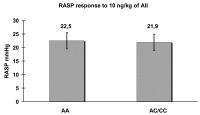
Angiotensin II - Dosierung
Figure 3: Among the patients who required >= 10 ng/kg to achieve AII Pd 20 (n = 29) RASP response to 10 ng/kg AII was identical. Graph represents the increase of RASP to 10 ng/kg AII among AA and AC/CC genotype 22.5 +/- 2.8 vs. 21.9 +/. 3.3 mmHg respectively (p = 0.9).


Keywords: Angiotensin IIAngiotensin IIArteria radialisArteria radialisblood pressureBlutdruckDiagrammSystoleSystole


copyright © 2000–2025 Krause & Pachernegg GmbH | Sitemap | Datenschutz | Impressum
 
Werbung