Krause und Pachernegg
Verlag für Medizin und Wirtschaft
Artikel   Bilder   Volltext

Mobile Version
A-  |   A  |   A+
Werbung
 
Figures and Graphics
Cugini P et al.  
Evidence that the information entropy estimating the nonlinear variability of human sinusial R-R intervals shows a circadian rhythm

Journal of Clinical and Basic Cardiology 1999; 2 (2): 275-278

PDF    Summary    Figures   


Figure
 
Zirkadianer Rhythmus
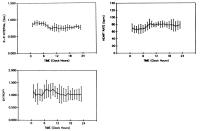
Figure 1: Mean chronograms provided by conventional parametric biometry applied to the hourly-qualified values of the sinusal R-R interval, heart rate and information entropy measurement in clinically healthy subjects


Keywords: blood pressureBlutdruckchronogramChronogrammDiagrammEntropieentropyheart rateHerzfrequenz
 
 
Zirkadianer Rhythmus
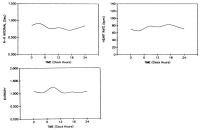
Figure 2: Mean cosinograms provided by the three-component harmonic method applied to the hourly-qualified values of the sinusal R-R interval, heart rate and information entropy measurement in clinically healthy subjects


Keywords: blood pressureBlutdruckcosinogramCosinogrammDiagrammEntropieentropyheart rateHerzfrequenz


copyright © 2000–2025 Krause & Pachernegg GmbH | Sitemap | Datenschutz | Impressum
 
Werbung