| Elshamaa MF et al. | ||||||||||||||||
|---|---|---|---|---|---|---|---|---|---|---|---|---|---|---|---|---|
|
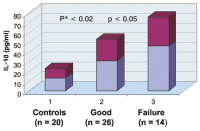
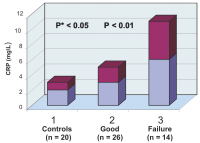
Serum Interleukin-10 Levels and Microinflammation in Vascular Access Failure in Egyptian Children on Hemodialysis
Journal of Clinical and Basic Cardiology 2009; 12 (1-4): 18-23 PDF Summary Figures
|
||||||||||||||||

Verlag für Medizin und Wirtschaft |
|
||||||||
|
Figures and Graphics
|
|||||||||
| copyright © 2000–2025 Krause & Pachernegg GmbH | Sitemap | Datenschutz | Impressum | |||||||||
|
|||||||||

