Krause und Pachernegg
Verlag für Medizin und Wirtschaft
Artikel   Bilder   Volltext

Mobile Version
A-  |   A  |   A+
Werbung
 
Figures and Graphics
Cugini P et al.  
Is a Reduced Entropy in Heart Rate Variability an Early Finding of Silent Cardiac Neurovegetative Dysautonomia in Type 2 Diabetes Mellitus?

Journal of Clinical and Basic Cardiology 2001; 4 (4): 289-294

PDF    Summary    Figures   


Figure
 
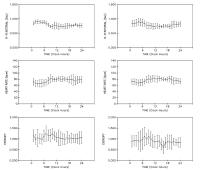
Chronogramm - Blutdruck - Herzfrequenz - Entropie
Figure 1: Within-day profiles of the hourly-qualified mean values (+/- SD, mean chronograms) of sinusal R-R interval, heart rate and entropy in clinically healthy subjects (left panels) and patients affected by type 2 diabetes mellitus (right panels)


Keywords: blood pressureBlutdruckchronogramChronogrammDiabetes mellitus Typ 2diabetes mellitus type 2DiagrammEntropieentropyheart rateHerzfrequenz
 
 
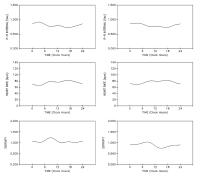
Chronogramm - Herzfrequenz - Blutdruck - Entropie
Figure 2: Within-day best-fitting (three-component) harmonic oscillations (mean cosinorgams) of the hourly-qualified series of sinusal R-R interval, heart rate and entropy in clinically healthy subjects (left panels) and patients affected by type 2 diabetes mellitus (right panels)


Keywords: blood pressureBlutdruckchronogramChronogrammDiabetes mellitus Typ 2diabetes mellitus type 2DiagrammEntropieentropyheart rateHerzfrequenz


copyright © 2000–2025 Krause & Pachernegg GmbH | Sitemap | Datenschutz | Impressum
 
Werbung