Gaspardone A, Chiariello L, Crea F, De Matteis GM, Gioffrè PA, Polisca P, Proietti I, Tomai F, Versaci F Temporal Sequence and Spatial Distribution of Ischaemic Changes During Dipyridamole Stress Test - the Key Role of Microvascular Dysfunction Journal of Clinical and Basic Cardiology 2005; 8 (1-4): 47-53 PDF Summary Overview
| ||||||||
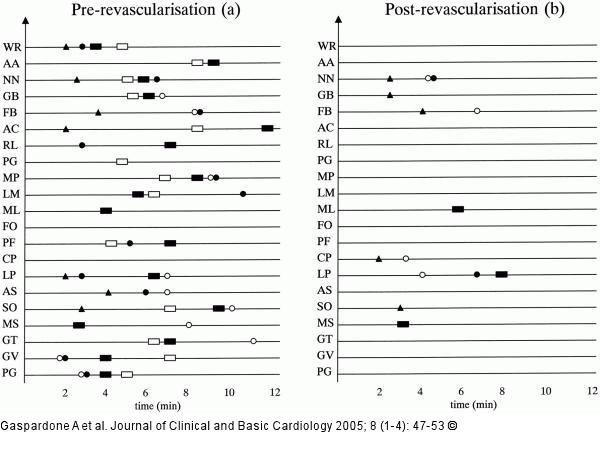
Figure/Graphic 2: Ischaemic events - Temporal sequence Schematic representation of the temporal sequence of ischaemic events during dipyridamole infusion in each patient before (panel a) and after (panel b) coronary artery revascularisation. Black squares: angina pectoris; white squares: electrocardiographic ischaemic changes; black circles: echocardiographic alterations in non-LAD-dependent myocardial segments; white circles: echocardiographic alterations in LAD-dependent myocardial segments; black triangles: Doppler mitral flow abnormality. LAD: left anterior descending coronary artery |

Figure/Graphic 2: Ischaemic events - Temporal sequence
Schematic representation of the temporal sequence of ischaemic events during dipyridamole infusion in each patient before (panel a) and after (panel b) coronary artery revascularisation. Black squares: angina pectoris; white squares: electrocardiographic ischaemic changes; black circles: echocardiographic alterations in non-LAD-dependent myocardial segments; white circles: echocardiographic alterations in LAD-dependent myocardial segments; black triangles: Doppler mitral flow abnormality. LAD: left anterior descending coronary artery |


