Huber K Brief des Herausgebers Journal für Kardiologie - Austrian Journal of Cardiology 2007; 14 (1-2): I Volltext (PDF) Übersicht
| ||
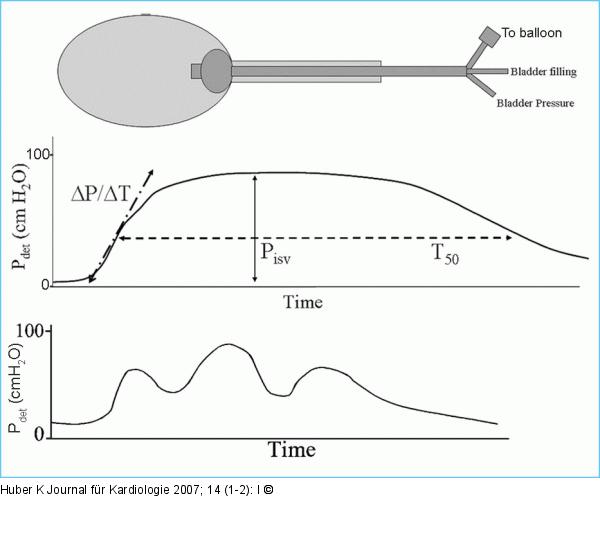
Abbildung 1: Continuous occlusion test Schematic diagram of isometric pressure generated during the continuous occlusion test. Foley catheter is inserted into the bladder for simultaneous bladder filling and measurement of bladder pressure. From the detrusor contraction that is generated, the maximum isovolumetric pressure (Pisv), the slope of the contraction (deltaP/deltaT) and the duration that the isometric contraction remains above 50 % of its maximum (T50) can be determined. Top tracing demonstrates strong bladder contractility while bottom tracing reflects contraction that attains a similar maximum isovolumetric pressure but is phasic and poorly sustained. |

Abbildung 1: Continuous occlusion test
Schematic diagram of isometric pressure generated during the continuous occlusion test. Foley catheter is inserted into the bladder for simultaneous bladder filling and measurement of bladder pressure. From the detrusor contraction that is generated, the maximum isovolumetric pressure (Pisv), the slope of the contraction (deltaP/deltaT) and the duration that the isometric contraction remains above 50 % of its maximum (T50) can be determined. Top tracing demonstrates strong bladder contractility while bottom tracing reflects contraction that attains a similar maximum isovolumetric pressure but is phasic and poorly sustained. |

