Gasser R, Gasser S, Ablasser K, Scherr E, Roessl U, Lewinski D, Mangge H, Dellacher A, Mächler H, Trantina-Yates A, Tscheliessnigg KH Quantification of GLUT4 Gene Expression in Human Atrial Myocardium of Hypertensive Patients and the Effect of Experimental Ischaemia Thereupon Journal of Clinical and Basic Cardiology 2007; 10 (1-4): 1-6 PDF Summary Overview
| ||||||
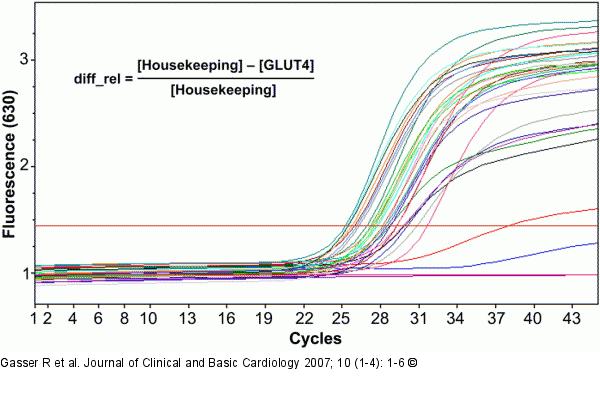
Figure/Graphic 1: GLUT4 The amount of cycles needed for the amplification curve to exceed the background fluorescence (dashed line) represents the CT value. The quantity of myocardial cellular GLUT4 gene expression is shown as relative difference, which is calculated from the CT values of the housekeeping and the GLUT4 PCR. |

Figure/Graphic 1: GLUT4
The amount of cycles needed for the amplification curve to exceed the background fluorescence (dashed line) represents the CT value. The quantity of myocardial cellular GLUT4 gene expression is shown as relative difference, which is calculated from the CT values of the housekeeping and the GLUT4 PCR. |


