| |
| Alle Journale wurden nach Graph durchsucht |
Treffer 1 - 24 von 24 |
|
|
|---|
Unterbegriffe: AVERT-Angiographie,
Abdomen-Computertomographie,
Abdomen-Sonographie,
Abschluss-Angiographie,
Abschlussangiographie,
Abschlußarteriographie,
Agraphie,
Aktigraphie,
Akut-Koronarangiographie,
Akutkoronarangiographie,
Ammoniak-Positronenemissionstomographie,
Ammoniak-Positronenemmissionstomographie,
Amyloidose-Skelett-Szintigraphie,
Angiocardiography,
Angiographic,
Angiographically,
Angiographie,
Angiographieaufnahme,
Angiographiebefund,
Angiographieeinheit
|
1. Uckermann O;
Galli R;
Mackenroth L;
Geiger K;
Steiner G;
Koch E;
Schackert G;
Kirsch M
Optical Biochemical Imaging: Potential New Applications in Neuro-Oncology
CARS image
European Association of NeuroOncology Magazine 2014; 4 (1): 20-26
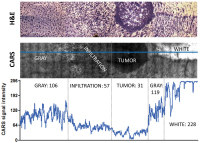
CARS microscopy of infiltrative experimental
glioblastoma in a mouse model: The intensity of the CARS image and the morphological details permit to distinguish between the tumour mass, the infiltrative area, and the normal brain grey and white matters. H&E staining (top) CARS image (centre). The intensity of the CARS signal along the blue line is plotted in the graph (bottom). Mean intensity values for the different types of tissue are also reported. Mean intensity that characterizes the normal grey tissue is reduced to approximately 50 % in the infiltrative area and to approximately 30 % in the tumour. Lipid rich white matter is characterized by high CARS signal intensity (228, saturation in some areas). Keywords: CARS image,
scheme
|
|
|
2. Frohner R;
Würtz RP;
Kosilek R;
Schneider HJ
Optimierung der Gesichtsklassifikation bei der Erkennung von Akromegalie
Gesichtsklassifikation
Journal für Klinische Endokrinologie und Stoffwechsel - Austrian Journal of Clinical Endocrinology and Metabolism 2013; 6 (3): 20-24
Neu entwickelter Graph für die Klassifikation „Akromegalie“. Der neu entwickelte Graph enthält neben der exakten Beschreibung der verwendeten Gesichtsmerkmale Strecken- und Winkelbeziehungen, um das gegebenenfalls notwendige manuelle Nachjustieren der Knoten bei schlechter Bildqualität zu erleichtern. Keywords: Akromegalie,
FIDA,
Foto,
Gesichtsklassifikation,
graph,
Klassifikation
|
|
|
3. Frohner R;
Würtz RP;
Kosilek R;
Schneider HJ
Optimierung der Gesichtsklassifikation bei der Erkennung von Akromegalie
Gesichtsklassifikation
Journal für Klinische Endokrinologie und Stoffwechsel - Austrian Journal of Clinical Endocrinology and Metabolism 2013; 6 (3): 20-24
Die modifizierten Graphen für die Seitenansicht (links Standardgraph, Mitte nach dem ersten, rechts nach dem zweiten Optimierungsschritt). Keywords: Akromegalie,
FIDA,
Foto,
Gesichtsklassifikation,
graph,
Optimierung
|
|
|
4. Frohner R;
Würtz RP;
Kosilek R;
Schneider HJ
Optimierung der Gesichtsklassifikation bei der Erkennung von Akromegalie
Gesichtsklassifikation
Journal für Klinische Endokrinologie und Stoffwechsel - Austrian Journal of Clinical Endocrinology and Metabolism 2013; 6 (3): 20-24
Im Rahmen der Optimierung „irrelevanter Knoten“ ermittelte Knoten und deren Cluster. Frontansicht: Cluster F1, Seitenansicht: S1, S2. Die Graphen werden modifiziert und es entsteht ein neuer Graph basierend auf den Originalknoten, jedoch ohne die identifizierten Clusterknoten. Keywords: Akromegalie,
Cluster,
FIDA,
Foto,
Gesichtsklassifikation,
graph,
Optimierung
|
|
|
5. Frohner R;
Würtz RP;
Kosilek R;
Schneider HJ
Optimierung der Gesichtsklassifikation bei der Erkennung von Akromegalie
Gesichtsklassifikation
Journal für Klinische Endokrinologie und Stoffwechsel - Austrian Journal of Clinical Endocrinology and Metabolism 2013; 6 (3): 20-24
Frontansicht eines Probanden sowie überlagernder Graph. Graph mit Knotenpunkten (rot) und Verbindungslinien (grün) integriert in FIDA. Keywords: Akromegalie,
FIDA,
Foto,
Gesichtsklassifikation,
graph
|
|
|
6. Muschitz Ch;
Dimai H-P;
Kocijan R;
Kaider A;
Resch H
The Discriminatory Capacity of BMD Measurements by DXL at the Calcaneus and DXA at the Hip and Spine Including Clinical Risk Factors to Detecting Patients with Vertebral Fractures
BMD-Measurements
Journal für Mineralstoffwechsel & Muskuloskelettale Erkrankungen 2013; 20 (2): 52-56
Delineation of improvement in prediction of fracture by combination of BMD measurement with CRF according to the FRAX®; AUC for DXA = BMD femoral neck; AUC for DXL = BMD calcaneus; graphs show different BMD measurements; (A) ROC of CRF without BMD measurement, (B) ROC curves of CRF and BMD measurements (DXA femoral neck/DXL calcaneus). Keywords: BMD Measurements,
BMD-Messungen,
CRF,
CRF,
diagram,
Diagramm,
DXA,
DXA,
DXL,
DXL,
Mineralstoffwechsel,
Osteoporose,
osteoporosis
|
|
|
7. Baulmann J;
Weber T;
Mortensen K
Messmethoden der Arteriellen Gefäßsteifigkeit
Pulswellen - Messung
Journal für Hypertonie - Austrian Journal of Hypertension 2010; 14 (2): 18-24
Oszillometrisch
an der A. brachialis
aufgezeichnete
Pulswellen mittels
Mobil-O- Graph mit
Befundanzeige der
über 24 h ermittelten
Rohdaten (Originalbefund)
und Berechnung
von Herzminutenvolumen
(ocker),
Augmentationsindex
normiert auf eine
Herzfrequenz von
75 (grün), peripherem
Blutdruck (blau) und
Herzfrequenz (rot) bei
einem 45-Jährigen. Keywords: Hypertonie,
Messung,
Pulswellen
|
|
|
8. Cooper TG;
Hellenkemper B;
Nieschlag E
External Quality Control for Semen Analysis in Germany - Qualitätskontrolle der Deutschen Gesellschaft für Andrologie (QuaDEGA). The First 5 Years
Sperm concentration
Journal für Reproduktionsmedizin und Endokrinologie - Journal of Reproductive Medicine and Endocrinology 2007; 4 (6): 331-335
A Youden plot of sperm concentration. For a given distribution, the results of the assessments of each centre for Sample A (abscissa) is plotted against the assessments of the same centre for Sample B (ordinate). The target ranges for the concentration in each sample (provided by reference centres) is shown between the dotted lines on each axis
and they overlap to define the target window (solid line). The positions of points outside the target window indicate random errors (R) or systematic
errors (S). The graph is thus divided into 9 areas and Ranks are awarded for falling within the target window (Rank 1), for having random errors (Rank 2 in R2), systematic errors (Ranks 3 in S3) and extreme random errors (Rank 4 in R4). Keywords: Diagramm,
flowchart,
Reproduktionsmedizin,
sperm concentration,
Spermienkonzentration,
Youden plot
|
|
|
9. Krampla W;
Newrkla S;
Huber K;
Hawa G;
Posch M;
Fendt S;
Katschnig I;
Kröner A;
Hayden E;
Kittl E;
Eyb R;
Hruby W
Osteoprotegerin - ein neuer Laborparameter zur Unterstützung der radiologischen Diagnostik rezenter Frakturen?
OPG-Serumkonzentrationen vor und nach Wirbelsäulenoperation
Journal für Mineralstoffwechsel & Muskuloskelettale Erkrankungen 2007; 14 (2): 61-67
OPG-Serumkonzentrationen der Patientengruppe 2 vor und nach der Wirbelsäulenoperation (zwei Probanden zeigten jeweils die gleichen ansteigenden Anfangs- und Endwerte; somit ist in der Abbildung eine Überlagerung der Graphen bei 5 bis 7 zu beachten). Keywords: Mineralstoffwechsel,
Osteoprotegerin,
serum concentration,
Serumkonzentration
|
|
|
10. Beythien Ch;
Brockmann MA;
Gutensohn K;
Nienaber CA
Increased Platelet Activation by PTFE-Covered Coronary Stent Grafts: A Flow Cytometric Analysis in a Pulsed Floating Model of Recirculating Human Plasma
Plättchenaktivierung - In-vitro-Modell
Journal für Kardiologie - Austrian Journal of Cardiology 2004; 11 (7-8): 322-325
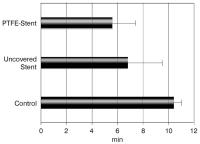
Bar graph of the time until stent thrombosis, and thrombus development in the tubing system of the in vitro model respectively. Values are means ± SD; # p = 0.035 vs. PTFE-stents, p < 0.0001 vs. control system without stent. Keywords: Diagramm,
Kardiologie,
Stent,
Stentthrombose
|
|
|
11. Beythien Ch;
Brockmann MA;
Gutensohn K;
Nienaber CA
Increased Platelet Activation by PTFE-Covered Coronary Stent Grafts: A Flow Cytometric Analysis in a Pulsed Floating Model of Recirculating Human Plasma
Plättchenaktivierung - In-vitro-Modell
Journal für Kardiologie - Austrian Journal of Cardiology 2004; 11 (7-8): 322-325
Bar graph of the time until the occurrence of platelet aggregates after initiation
of circulation of platelet-rich-plasma in the in vitro model. Values are means ± SD; # p = 0.04 vs. PTFE stents, p < 0.0005 vs. control system without stent. Keywords: Diagramm,
Kardiologie,
Plättchenaggregation,
Stent
|
|
|
12. Wascher TC
Diabetes Mellitus - How to Prevent Macrovascular Disease?
UKPDS - Complications - Blood Pressure
Journal für Kardiologie - Austrian Journal of Cardiology 2003; 10 (4): 149-151
Rate of microvascular complications and myocardial infarction in the UKPDS according to the mean updated systolic blood pressure over the entire study duration (corrected for age, gender and ethnicity). Modified from [6] Keywords: cardiology,
Grafik,
graph,
Kardiologie,
Microvascular Complications,
mikrovaskuläre Komplikationen,
myocardial infarction,
Myokardinfarkt,
systolic blood pressure,
systolischer Blutdruck,
UKPDS-Studie,
UKPDS-Studie
|
|
|
13. Wascher TC
Diabetes Mellitus - How to Prevent Macrovascular Disease?
UKPDS - Complications - MI
Journal für Kardiologie - Austrian Journal of Cardiology 2003; 10 (4): 149-151
Rate of microvascular complications and myocardial infarction in the UKPDS according to the mean updated HbA1c over the entire study duration (Corrected for age, gender and ethnicity). Modified from [3] Keywords: cardiology,
Grafik,
graph,
HbA1c,
HbA1c,
Kardiologie,
Microvascular Complications,
mikrovaskuläre Komplikationen,
myocardial infarction,
Myokardinfarkt,
UKPDS-Studie,
UKPDS-Studie
|
|
|
|
|
|
|
|
|
16. Kuntz-Hehner St;
Becher H;
Luederitz B;
Omran H;
Schlosser Th;
Tiemann K
Assessment of Myocardial Perfusion by Contrast Echocardiography - Ready for Clinical Practice?
Kontrastechokardiographie
Journal of Clinical and Basic Cardiology 2002; 5 (2): 145-148
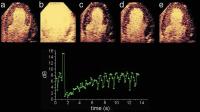
Negative bolus destruction reperfusion study using power pulse inversion imaging. First, continuous infusion of a contrast agent is adjusted to achieve full myocardial opacification using real-time imaging at very low emission power (a) (MI = 0.09). After destruction of the microbubbles by a short period of high power imaging (b) (MI = 1.3) myocardial contrast replenishment is recorded at low emission power (c–e) (MI = 0.09). A region of interest (ROI) is placed in the septum and repeated
measurements are made at the endsystolic frames. The graph shows the reperfusion curve for this ROI, fitting well to the monoexponential function. Keywords: Contrast agent,
echocardiography,
Echokardiographie,
Kontrastmittel,
reperfusion,
reperfusion
|
|
|
17. Kiowski W;
Riebenfeld D
A Practitioner Based Evaluation of Nicorandil on Symptoms and Quality of Life in Patients with Chronic Stable Angina Pectoris
Nicorandil - Lebensqualität
Journal of Clinical and Basic Cardiology 2001; 4 (2): 149-152
Line graph of averages of weekly assessments of patients’ quality of life based upon four questions. A score of 1 was considered best and a score of 5 as worst for the respective questions. Results are presented for those 121 patients who correctly filled out the weekly questionnaire and who completed the 12 week-treatment period Keywords: Angina pectoris,
Angina pectoris,
Diagramm,
Lebensqualität,
Nicorandil,
Nicorandil,
quality of life
|
|
|
18. Malendowicz SL;
Chen T;
Ennezat PF;
Evans T;
Jorde UP;
LeJemtel TH;
Murray L;
Sonnenblick EH
The 1166A/C polymorphism of the angiotensin II type 1 receptor gene does not correlate with the blood pressure response to angiotensin II in patients with CHF
Angiotensin II - Dosierung
Journal of Clinical and Basic Cardiology 2001; 4 (1): 75-77
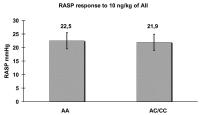
Among the patients who required >= 10 ng/kg to achieve AII Pd 20 (n = 29) RASP response to 10 ng/kg AII was identical. Graph represents the increase of RASP to 10 ng/kg AII among AA and AC/CC genotype 22.5 +/- 2.8 vs. 21.9 +/. 3.3 mmHg respectively (p = 0.9). Keywords: Angiotensin II,
Angiotensin II,
Arteria radialis,
Arteria radialis,
blood pressure,
Blutdruck,
Diagramm,
Systole,
Systole
|
|
|
19. Malendowicz SL;
Chen T;
Ennezat PF;
Evans T;
Jorde UP;
LeJemtel TH;
Murray L;
Sonnenblick EH
The 1166A/C polymorphism of the angiotensin II type 1 receptor gene does not correlate with the blood pressure response to angiotensin II in patients with CHF
Angiotensin II - Dosierung
Journal of Clinical and Basic Cardiology 2001; 4 (1): 75-77
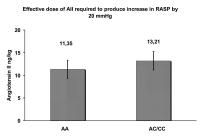
Effective dose of Angiotensin II (AII) (ng/kg) (Pd 20) required to produce increase in Radial Artery Systolic Pressure (RASP) by 20 mmg/Hg was similar in patients with AA and AC/CC polymorphism of AT1 receptor gene. Graph represents the AII Pd 20 in patients with AA and AC/CC polymorphism of AT1 receptor gene 11.35 +/- 1.18 vs 13.21 +/- 2.2 respectively (p = 0.42). Keywords: Angiotensin II,
Angiotensin II,
Arteria radialis,
Arteria radialis,
blood pressure,
Blutdruck,
Diagramm,
dosage,
Dosierung,
Systole,
Systole
|
|
|
20. Malendowicz SL;
Chen T;
Ennezat PF;
Evans T;
Jorde UP;
LeJemtel TH;
Murray L;
Sonnenblick EH
The 1166A/C polymorphism of the angiotensin II type 1 receptor gene does not correlate with the blood pressure response to angiotensin II in patients with CHF
Angiotensin II - Dosierung
Journal of Clinical and Basic Cardiology 2001; 4 (1): 75-77
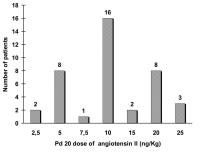
Pd 20 dose of Angiotensin II ng/kg varied from 2.5 to 25 ng/kg (median of 10 ng/kg) thorough the patients population. Graph represents the number of patients in each group of effective dose of Angiotensin II (Pd20) (ng/kg). Keywords: Angiotensin II,
Angiotensin II,
Diagramm,
dosage,
Dosierung
|
|
|
21. Metzler B;
Bilgeri R;
Pachinger O
Fulminant course of hypertension caused by phaeochromocytoma
Phäochromozytom - Blutdruck
Journal of Clinical and Basic Cardiology 2000; 3 (1): 67-68
Thirteen-hour systolic and diastolic blood pressure monitoring graph of an antihypertensive treated patient with an unknown Phaeochromocytoma. The x axis indicates the time after admission to hospital (h); the y-axis the blood pressure in mmHg. Keywords: blood pressure,
Blutdruck,
Diagramm,
hypertension,
Hypertonie,
phaeochromocytoma,
Phäochromozytom
|
|
|
22. Salvadori A;
Arreghini M;
Bolla G;
Fanari P;
Giacomotti E;
Longhini E;
Miserocchi G;
Palmulli P
Cardiovascular and adrenergic response to exercise in obese subjects
Schlaganfall - Sauerstoffverbrauch - Adipositas
Journal of Clinical and Basic Cardiology 1999; 2 (2): 229-236
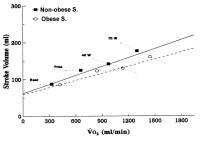
Relationship of stroke volume vs. oxygen consumption (V·O2) in non-obese and obese subjects. The graph reports iso-workload lines. The regression was: Stroke Volume = 0.062 + 0.001 V·O2 - 0.003Z (R²: 0.53; F: 31; MSE: 0.001), with a dummy variable Z = 1 for the obese subjects and 0 for the non-obese subjects. The relationship relative to obese subjects displays statistically similar slopes and a lower intercept compared to controls (p < 0.01). Keywords: Adipositas,
Diagramm,
obesity,
oxygen consumption,
Sauerstoffverbrauch,
Schlaganfall,
stroke
|
|
|
23. Sandmann S;
Unger T
L- and T-type calcium channel blockade - the efficacy of the calcium channel antagonist mibefradil
Kalziumkanal - Mibefradil
Journal of Clinical and Basic Cardiology 1999; 2 (2): 187-201
Bar graph showing changes in the number and duration of silent ischaemia events with mibefradil treatment. A significant linear dose-response relation is shown across all treatment groups for ischaemic events and ischaemia duration, p < 0.001. Keywords: calcium channel,
Diagramm,
ischaemia,
Ischämie,
Kalziumkanal,
mibefradil,
mibefradil
|
|
|
24. Sabbah HN;
Goldstein S;
Sharov VG
Remodeling of the cardiac interstitium in the progression of heart failure
Herzinsuffizienz - Progression
Journal of Clinical and Basic Cardiology 1999; 2 (1): 113-116
Bar graph (mean +/- SEM) depicting changes in volume fraction of reactive interstitial fibrosis (RIF), capillary density (C/F Ratio), oxygen diffusion distance (ODD) and average myocyte cross-sectional area (MCSA) in LV myocardium of normal dogs (NL), dogs with heart failure (CHF) sacrificed at 2 weeks (2w) and 4 months (4m) after the last embolization. *= p < 0.05 2w vs. 4m Keywords: Diagramm,
heart failure,
Herzinsuffizienz,
Progression,
Progression
|
|
|
| |
|

 Suche Medizinische Publikationen
 Suche Abbildungen und Grafiken
 Medizinprodukte - Labortechnik
 Antidotarium (Stand 2012)
 Phytokodex (Stand 2012)
 Fachbücher
 Patientenliteratur