Krause und Pachernegg
Verlag für Medizin und Wirtschaft
Artikel   Bilder   Volltext

Mobile Version
A-  |   A  |   A+
Werbung
 
Figures and Graphics
Perneczky G et al.  
Spinal Meningiomas: A Comprehensive Overview and Own Experience

European Association of NeuroOncology Magazine 2013; 3 (3): 118-121

PDF    Summary    Figures   


Figure
 
Spinal Meningioma
Figure 1a-e: Pre- and intraoperative findings: (a) T2-weighted native sagittal MR image: the tumour can be nicely delineated (red arrow). (b, c) Axial T1-weighted contrastenhanced sequence: inhomogeneous contrast enhancement is due to intratumoural calcifications (red arrow). (d) Sagittal contrast-enhanced T1-weighted image: again, the calcifications can be seen as contrast agent-free areas within the tumour (red arrow). (e) Intraoperative findings: the spinal cord is carefully mobilized under IOM. The tumour (blue arrow) can be seen at the left ventral dura.


Keywords: MRIspinal meningioma
 
 
Spinal Menigioma
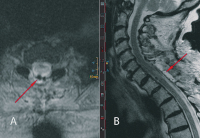
Figure 2: Postoperative MR scans: (a) T1-weighted contrast-enhanced MR images: the spinal cord (red arrow) is in normal location. No tumour remnants are visible. (b) T2-weighted native MR scan: the surgical dorsal approach and complete tumour removal are documented.


Keywords: MRIspinal meningioma


copyright © 2000–2025 Krause & Pachernegg GmbH | Sitemap | Datenschutz | Impressum