| Claessens P et al. |
|---|
Strain Imaging: Key to the Specific Left Ventricular Diastolic Properties in Endurance Trained Athletes
Journal of Clinical and Basic Cardiology 2003; 6 (1-4): 35-40
PDF Summary Figures
| Figure |
|---|
| |
|
|
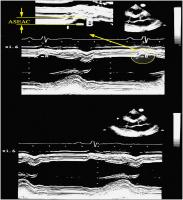
Athlet - ASEAC - Messung
Figure 1: Method to determine and quantify the ASEAC value.
Keywords: ASEAC,
ASEAC,
Athlet,
Athlet,
Ausdauer,
diastole,
diastole,
echocardiography,
Echokardiographie,
endocardium,
Endokard,
Endurance,
interventricular septum,
Interventrikuläres Septum,
left ventricle,
linker Ventrikel,
M-Mode,
M-Mode
|
| |
| |
|
|
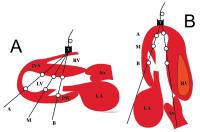
Athlet - Herz - Volumen
Figure 2: Parasternal long axis view (A), and longitudinal or apical long axis view (B) (T = transducer, B = basal site, M = middle site, A = apical site, IVS = interventricular septum, PW = posterior wall,
LV = left ventricle, RV = right ventricle, LA = left atrium, Ao = aorta).
Keywords: interventricular septum,
Interventrikuläres Septum,
Schema,
scheme,
ventricle,
Ventrikel
|
| |
| |
|
|
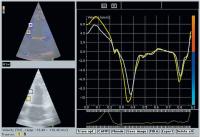
Athlet - Systole - Geschwindigkeit
Figure 3: Tissue Doppler imaging; measurements of peak systolic velocity, peak E- and peak A-velocities in the apical long axis.
Keywords: echocardiography,
Echokardiographie,
Gewebedoppler,
Strömungsgeschwindigkeit,
Systole,
Systole,
Tissue Doppler,
velocity
|
| |
| |
|
|
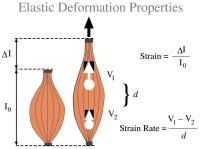
Athlet - Elasitizität - Deformation
Figure 4: Definition of strain and strain rate.
Keywords: Deformation,
Deformation,
elasticity,
Elastizität,
Schema,
scheme,
strain,
Verformung
|
| |
| |
|
|
Athlet - A-Wave
Figure 5a-b: A: Velocity curve (tissue Doppler imaging): localisation of the end of the A-wave and determination the time on the end of the
A-wave at the basal and middle septum in the long apical axis; B: Strain curve: measurement of the strain value at the time of the end
of the A-wave at the basal and middle septum in the long apical axis.
Keywords: A-Wave,
A-Wave,
echocardiography,
Echokardiographie,
Gewebedoppler,
strain,
Tissue Doppler,
Verformung
|
| |
| |
|
|
Athlet - Systole - E/A-Ratio
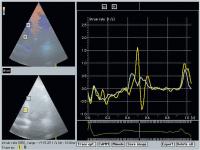
Figure 6: Measurement of the peak systolic strain rate and the E/A ratio strain rate in the longitudinal or apical long axis.
Keywords: E-A-Ratio,
E-A-Ratio,
echocardiography,
Echokardiographie,
strain,
systol,
Systole,
Verformung
|
| |
| |
|
|
Athlet - Ausdauer - Anpassung
Figure 7: Course of the integrated strain curve at the basal and mid septum in the longitudinal axis in the different groups.
Keywords: Athlet,
Athlet,
basal septum,
diagram,
Diagramm,
mid septum,
Septum,
strain,
Verformung
|
| |
| |
|
|

