Krause und Pachernegg
Verlag für Medizin und Wirtschaft
Artikel   Bilder   Volltext

Mobile Version
A-  |   A  |   A+
Werbung
 
Abbildungen und Graphiken
Beythien Ch et al.  
Increased Platelet Activation by PTFE-Covered Coronary Stent Grafts: A Flow Cytometric Analysis in a Pulsed Floating Model of Recirculating Human Plasma

Journal für Kardiologie - Austrian Journal of Cardiology 2004; 11 (7-8): 322-325

Volltext (PDF)    Summary    Abbildungen   


Abbildung
 
Plättchenaktivierung - In-vitro-Modell
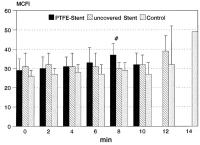
Abbildung 1: Bar chart of the changes of the expression of the platelet antigen CD62p (P-selectin) over 14 min course of circulation of platelet-rich-plasma in the in vitro model. Values are means ± SD; # p = 0.05 vs. uncovered stents.


Keywords: AktivierungsmarkerCD62pDiagrammKardiologieP-SelektinPlättchenaktivierungStent
 
 
Plättchenaktivierung - In-vitro-Modell
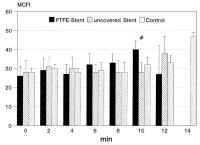
Abbildung 2: Bar chart of the changes of the expression of the platelet epitope CD63 (GP 53) over 14 min course of circulation of platelet-rich-plasma in the in vitro model. Values are means ± SD; # p = 0.05 vs. uncovered stents.


Keywords: AktivierungsmarkerCD63DiagrammGP53KardiologiePlättchenaktivierungStent
 
 
Plättchenaktivierung - In-vitro-Modell
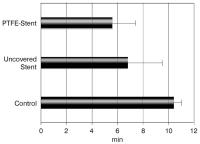
Abbildung 3: Bar graph of the time until the occurrence of platelet aggregates after initiation of circulation of platelet-rich-plasma in the in vitro model. Values are means ± SD; # p = 0.04 vs. PTFE stents, p < 0.0005 vs. control system without stent.


Keywords: DiagrammKardiologiePlättchenaggregationStent
 
 
Plättchenaktivierung - In-vitro-Modell
Abbildung 4: Bar graph of the time until stent thrombosis, and thrombus development in the tubing system of the in vitro model respectively. Values are means ± SD; # p = 0.035 vs. PTFE-stents, p < 0.0001 vs. control system without stent.


Keywords: DiagrammKardiologieStentStentthrombose


copyright © 2000–2025 Krause & Pachernegg GmbH | Sitemap | Datenschutz | Impressum
 
Werbung