| Salvadori A et al. |
|---|
Cardiovascular and adrenergic response to exercise in obese subjects
Journal of Clinical and Basic Cardiology 1999; 2 (2): 229-236
PDF Summary Figures
| Figure |
|---|
| |
|
|
Sauerstoffverbrauch - Adipositas
Figure 1: Oxygen consumption (V·O2) vs. watts relationship in nonobese and obese males and females. The regression lines were: V·O2 = 363.6 + 11.4 watt + 91.4Z2 (R2: 0.95; F: 1420; MSE: 10445) in the control group, and V·O2 = 615.3 +/- 12 watt (R2: 0.65; F: 93; MSE: 247.6) in the obese group, with a dummy variable Z2 = 1 for males and 0 for females in the regression line of the normal group because the two regression lines are parallel, but not coincident (p < 0.001).
Keywords: Adipositas,
Belastung,
Diagramm,
exercise,
Leistung,
obesity,
oxygen consumption,
Sauerstoffverbrauch
|
| |
| |
|
|
Herzfrequenz - Adipositas
Figure 2: Heart rate (HR) vs. watt relationship in non-obese and obese males and females. The regression lines were: HR = 90.7 + 0.7 watt - 14.2Z2 - 0.2 wattZ2 (R2: 0.8; F: 205; MSE: 248) in the control group, and: HR = 98 + 0.6 watt - 5.8Z2 - 0.2 wattZ2 (R2: 0.8; F: 180; MSE: 145) in the obese group, with a dummy variable Z2 = 1 for males and 0 for females because the two regression lines have significantly different slopes (P < 0.001)
Keywords: Adipositas,
Belastung,
Diagramm,
exercise,
heart rate,
Herzfrequenz,
Leistung,
obesity
|
| |
| |
|
|
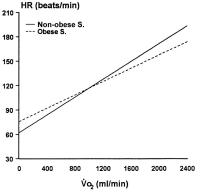
Herzfrequenz - Sauerstoffverbrauch
Figure 3: Heart rate (HR) vs. oxygen consumption (V·O2) relationship in non-obese and obese subjects. The regression was: HR = 66.576 + 0.05 V·O2 + 11.44Z + 0.01 V·O2Z (R2: 0.65, F: 93; MSE: 247.6), with a dummy variable Z= 1 for the obese subjects and 0 for the non-obese. The two straight lines have statistically different slopes (p < 0.05).
Keywords: Adipositas,
Diagramm,
heart rate,
Herzfrequenz,
obesity,
oxygen consumption,
Sauerstoffverbrauch
|
| |
| |
|
|
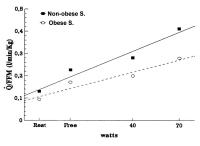
Blutfluß - Adipositas
Figure 4: Blood flow per unit body fat-free mass (Q·/FFM) plotted vs. mechanical power output in control and obese subjects. The regression was: Q·/FFM = 0.169 + 0.003 watt - 0.045Z - 0.001 wattZ (R2: 0.69; F: 53; MSE: 0.004), with a dummy variable Z= 1 for the obese subjects and 0 for the non-obese subjects. The regression for obese subjects displays a significantly lower slope compared to controls (p < 0.05).
Keywords: Adipositas,
Belastung,
blood flow,
Blutfluss,
Diagramm,
exercise,
Leistung,
obesity
|
| |
| |
|
|
Sauerstoffverbrauch - Adipositas
Figure 5: Relationship between oxygen consumption, normalised for fat free mass (V·O2/FFM) vs. mechanical power output. ATN and ATO refer to anaerobic threshold for non-obese and obese subjects. *= p < 0.05
Keywords: Adipositas,
Belastung,
Diagramm,
exercise,
Leistung,
obesity,
oxygen consumption,
Sauerstoffverbrauch
|
| |
| |
|
|
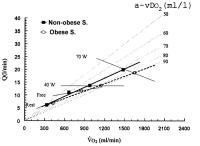
Cardiac Output - Sauerstoffverbrauch - Adipositas
Figure 6: Cardiac output (Q·) vs. oxygen consumption (V·O2) in nonobese and obese subjects with increasing workload. Also shown are iso-workload and iso-arterio-venous oxygen difference lines (a-vDO2).
The regression was: Q· = 2.414 + 0.01 V·O2 + 0.494Z - 0.0021 V·O2Z (R²: 0.83; F: 133; MSE: 4.5), with a dummy variable Z = 1 for the obese and 0 for the non-obese subjects. The regression for obese subjects displays a significantly lower slope compared to controls (p < 0.05).
Keywords: Adipositas,
cardiac output,
cardiac output,
Diagramm,
Herzleistung,
obesity,
oxygen consumption,
Sauerstoffverbrauch
|
| |
| |
|
|
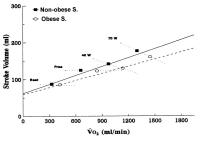
Schlaganfall - Sauerstoffverbrauch - Adipositas
Figure 7: Relationship of stroke volume vs. oxygen consumption (V·O2) in non-obese and obese subjects. The graph reports iso-workload lines. The regression was: Stroke Volume = 0.062 + 0.001 V·O2 - 0.003Z (R²: 0.53; F: 31; MSE: 0.001), with a dummy variable Z = 1 for the obese subjects and 0 for the non-obese subjects. The relationship relative to obese subjects displays statistically similar slopes and a lower intercept compared to controls (p < 0.01).
Keywords: Adipositas,
Diagramm,
obesity,
oxygen consumption,
Sauerstoffverbrauch,
Schlaganfall,
stroke
|
| |
| |
|
|
Herzfrequenz - Systolischer Blutdruck - Adipositas
Figure 8A-B: Heart rate systolic pressure product (HRP) plotted vs. mechanical power output in control and obese subjects. B. Ratio of heart rate systolic pressure product to oxygen consumption (HRP/V·O2) plotted vs. mechanical power.
Keywords: Adipositas,
Belastung,
Diagramm,
exercise,
heart rate,
Herzfrequenz,
Leistung,
obesity,
systolic blood pressure,
systolischer Blutdruck
|
| |
| |
|
|
Epinephrin - Adipositas
Figure 9A-B: Increments of epinephrine during progressive workloads. * = p < 0.05 normal vs. obese subjects; # = p < 0.05 exercise vs. rest values; ## = p < 0.01 exercise vs. rest values. 9B. Plots of epinephrine vs. HR in non-obese and obese subjects. The regression was exponential for the non-obese subjects: E = exp (1.646 + 0.01 HR) (R²: 0.49; F: 36; MSE: 0.4) and linear for the obese subjects: E= -2.11 + 0.581 HR (R²: 0.23; F: 22; MSE: 900).
Keywords: Adipositas,
Belastung,
Diagramm,
Epinephrin,
epinephrine,
exercise,
heart rate,
Herzfrequenz,
Leistung,
obesity,
workload
|
| |
| |
|
|


