Salvadori A, Arreghini M, Bolla G, Fanari P, Giacomotti E, Longhini E, Miserocchi G, Palmulli P Cardiovascular and adrenergic response to exercise in obese subjects Journal of Clinical and Basic Cardiology 1999; 2 (2): 229-236 PDF Summary Overview
| ||||||||||||||||||
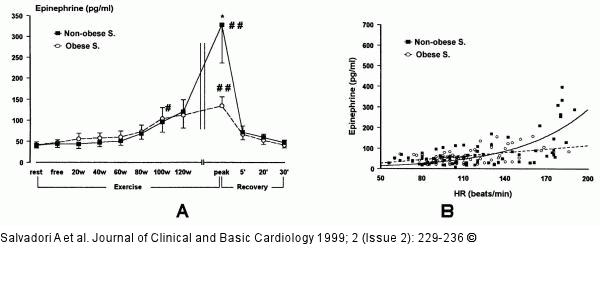
Figure/Graphic 9A-B: Epinephrin - Adipositas Increments of epinephrine during progressive workloads. * = p < 0.05 normal vs. obese subjects; # = p < 0.05 exercise vs. rest values; ## = p < 0.01 exercise vs. rest values. 9B. Plots of epinephrine vs. HR in non-obese and obese subjects. The regression was exponential for the non-obese subjects: E = exp (1.646 + 0.01 HR) (R²: 0.49; F: 36; MSE: 0.4) and linear for the obese subjects: E= -2.11 + 0.581 HR (R²: 0.23; F: 22; MSE: 900). |

Figure/Graphic 9A-B: Epinephrin - Adipositas
Increments of epinephrine during progressive workloads. * = p < 0.05 normal vs. obese subjects; # = p < 0.05 exercise vs. rest values; ## = p < 0.01 exercise vs. rest values. 9B. Plots of epinephrine vs. HR in non-obese and obese subjects. The regression was exponential for the non-obese subjects: E = exp (1.646 + 0.01 HR) (R²: 0.49; F: 36; MSE: 0.4) and linear for the obese subjects: E= -2.11 + 0.581 HR (R²: 0.23; F: 22; MSE: 900). |


