Krause und Pachernegg
Verlag für Medizin und Wirtschaft
Artikel   Bilder   Volltext

Mobile Version
A-  |   A  |   A+
Werbung
 
Figures and Graphics
Szili-Török T et al.  
Windowed FFT - a time-variant spectral analysis: applicability during the head-up tilt test

Journal of Clinical and Basic Cardiology 1999; 2 (2): 241-244

PDF    Summary    Figures   


Figure
 
Kipptisch
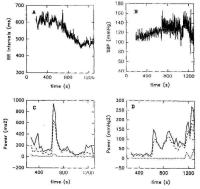
Figure 1A-D: Upright tilt-induced responses of a patient from the tilt-negative group. Panel A. Normal heart rate response to upright tilt. The postural change at 600 s of the recording is accompanied by a certain RR interval shortening. Panel B. Although the fluctuations in systolic BP are augmented following the upright tilt, no clinically significant hypotension is recorded. Panels C and D. Variations in HR (C) and systolic BP (D) powers with time, as assessed by the windowed FFT method. Solid lines indicate total power, dashed lines indicate LF power, and dotted lines indicate HF power. The upright tilt manoeuvre elicits transient elevations in the LFHRV and TFHRV power. The BP power reveal immediate tilt-related increases in the same spectral bands, followed by subsequent fluctuations of lesser magnitude. The terminal increases in the BPV components are related to the motion artefacts at the time of termination of tilting.


Keywords: blood pressureBlutdruckDiagrammheart rateHerzfrequenzKipptischtilt table
 
 
Kipptisch
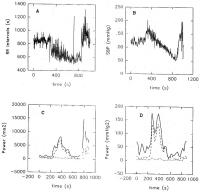
Figure 2A-D: Typical tilt-induced responses of a tilt-positive patient. Panel A. The RR interval tachogram. The tilting, indicated by a vertical line is reflected by an immediate HR acceleration. The sudden-onset bradycardia after 800 s of the recording coincides with the syncopal episode. Panel B. The systolic BP trend curve reveals transient stabilisation post-tilting, followed by a marked hypotension, eventually leading syncope. Panels C and D. Variations in HR (C) and systolic BP (D) with time, as assessed by windowed FFT in the same arrangement as in Figure 1. The upright tilt manoeuvre is paralleled by elevations in the LFHRV and TFHRV powers. The duration of the elevations in these frequency ranges is prolonged, however, relative to the normal, and they are interrupted by further peakings. The subsequent decreases in the spectral components precede the syncopal episode.


Keywords: blood pressureBlutdruckDiagrammKipptischtilt table
 
 
Kipptisch
Figure 3: 3D projection of the HRV (upper panel) and BPV (lower panel) spectral changes following the upright tilt as assessed by windowed FFT in the same syncopal patients as in Fig. 2. The spatial projection allows a thorough assessment of the temporal changes and interrelationship of all spectral components. Thus, it is apparent that the double elevation in the LFBPV response depicted in Fig. 2 is related to changes in different segments of the LF band. Even the two minor elevations in the HFBPV band are quite discernible.


Keywords: blood pressureBlutdruckDiagrammheart rateHerzfrequenzKipptischtilt table


copyright © 2000–2025 Krause & Pachernegg GmbH | Sitemap | Datenschutz | Impressum
 
Werbung