| Müller-Nordhorn J, Willich SN |
|---|
Triggering of acute coronary syndromes
Journal of Clinical and Basic Cardiology 2000; 3 (2): 73-79
PDF Summary Figures
| Figure |
|---|
| |
|
|
Auslöser für akute Koronarsyndrome
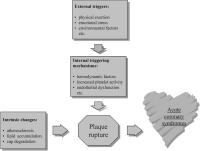
Figure 1: Model of triggering of acute coronary syndromes (see text for details)
Keywords: Acute Coronary Syndrome,
akutes Koronarsyndrom,
plaque rupture,
Plaqueruptur,
Schema
|
| |
| |
|
|
Myokardinfarkt - Belastung
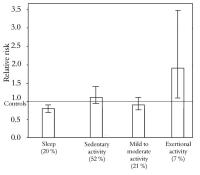
Figure 2: Physical activity at the onset of myocardial infarction. Adjusted odds ratios of physical activity states among patients with myocardial infarction compared with controls. Redrawn after [13]
Keywords: Activity,
Aktivität,
Belastung,
Diagramm,
myocardial infarction,
Myokardinfarkt
|
| |
| |
|
|
Myokardinfarkt - Wut - Ärger - Emotion
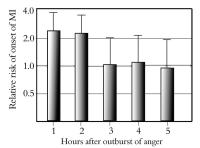
Figure 3: Relative risk of myocardial infarction in the hours following an outburst of anger. The error bars indicate the 95 % confidence intervals; the dotted line represents the baseline risk. Redrawn after [18]
Keywords: anger,
Diagramm,
Emotion,
Emotion,
myocardial infarction,
Myokardinfarkt,
Wut,
Ärger
|
| |
| |
|
|
Plötzlicher Herztod - Erdbeben
Figure 4: Daily incidence of sudden cardiac deaths associated with an earthquake. A major earthquake occurred in Northridge, California, on January 17, 1994. Redrawn after [25]
Keywords: Diagramm,
earthquake,
Erdbeben,
plötzlicher Herztod,
sudden cardiac death
|
| |
| |
|
|
Myokardinfarkt - Krieg
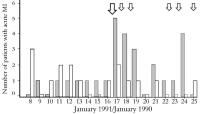
Figure 5: Daily incidence of acute myocardial infarction associated with war threat in a Tel Aviv population from 8th to 25th January 1991, compared with the same period in 1990. Large arrow = beginning of the Gulf war; small arrows = missile attacks on Israel. Redrawn after [26]
Keywords: Diagramm,
Israel,
Israel,
Krieg,
myocardial infarction,
Myokardinfarkt,
Tel Aviv,
Tel Aviv,
war
|
| |
| |
|
|
Myokardinfarkt - Tageszeit
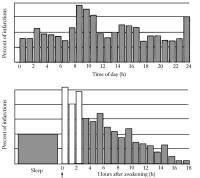
Figure 6: Circadian variation in the onset of myocardial infarction. The upper panel shows the unadjusted circadian pattern of myocardial infarction (P < 0.01); the lower panel the circadian pattern adjusted for time of awakening. Redrawn after [9]
Keywords: circadian variation,
Diagramm,
myocardial infarction,
Myokardinfarkt,
Tageszeit
|
| |
| |
|
|
Myokardinfarkt - wöchentliche Verteilung
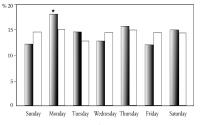
Figure 7: Weekly variation in the onset of myocardial infarction in a working (n = 884) and a non-working population (n = 1191) (1985–1990); grey bars = working (n = 884), white bars = non-working (n = 1191) * p < 0.05. Redrawn after [64]
Keywords: Arbeiter,
Diagramm,
myocardial infarction,
Myokardinfarkt,
weekly variation,
Wochentag,
worker
|
| |
| |
|
|

