2.
Arya A;
Fiedler L;
Dinov B;
Sommer P;
Gaspar T;
Rolf S;
Eitel C;
Breithardt O;
Piorkowski C;
Hindricks G
Long-Term Outcome of Catheter Ablation of Electrical Storm due to Recurrent Ventricular Tachycardia in a Large Cohort of Patients with Idiopathic Dilated Cardiomyopathy
Catheter Ablation
Journal für Kardiologie - Austrian Journal of Cardiology 2013; 20 (7-8): 212-215
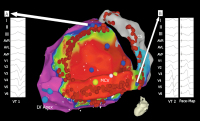
Electroanatomical bipolar voltage map of a left ventricle, the coronary sinus (CS) and the middle
cardiac vein (MCV) of a patient with nonischemic dilated cardiomyopathy and ventricular tachycardia (VT) is shown in a caudal left posterior oblique projection. Bipolar voltage of < 0.5 mV (suggestive of a dense scar) is depicted in red and the normal myocardium (with bipolar voltage > 1.5 mV) is represented in purple, with other colors corresponding to the intermediate signal amplitude seen in the scar’s border zone. (A) shows a 12-lead of VT 1 and (B) shows a 12-lead ECG of an VT 2 and corresponding pace map, pointed out from origin with white arrows. Dark blue dots indicate phrenicus capture, light blue dots indicate termination of VT during ablation. Red dots indicate
ablation points.
Keywords:
catheter ablation,
Kardiologie,
Katheterablation,
ventricular tachycardia,
ventrikuläre Tachykardie,
VT,
VT

 Suche Medizinische Publikationen
 Suche Abbildungen und Grafiken
 Medizinprodukte - Labortechnik
 Antidotarium (Stand 2012)
 Phytokodex (Stand 2012)
 Fachbücher
 Patientenliteratur