Krause und Pachernegg
Verlag für Medizin und Wirtschaft
Artikel   Bilder   Volltext

Mobile Version
A-  |   A  |   A+
Werbung
 
Figures and Graphics
Kuntz-Hehner St et al.  
Assessment of Myocardial Perfusion by Contrast Echocardiography - Ready for Clinical Practice?

Journal of Clinical and Basic Cardiology 2002; 5 (2): 145-148

PDF    Summary    Figures   


Figure
 
Kontrastechokardiographie
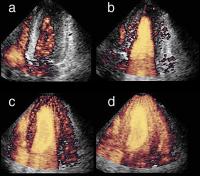
Figure 1a-d: Different degrees of myocardial contrast using harmonic power Doppler imaging (four chamber view) during continuous infusion of Levovist (R): Arrival of the contrast agent in the right ventricle (a) and complete left ventricular opacification shortly after (b) using triggered imaging every heart cycle (1:1). Complete left ventricular myocardial opacification using higher trigger intervals every 3rd (c) and every 5th (d) cardiac cycle.


Keywords: Contrast agentechocardiographyEchokardiographieFour chamber viewKontrastmittelLevovistLevovistSchering GesmbHSchering GesmbHVierkammerblick
 
 
Kontrastechokardiographie
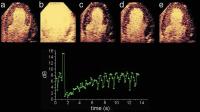
Figure 2a-e: Negative bolus destruction reperfusion study using power pulse inversion imaging. First, continuous infusion of a contrast agent is adjusted to achieve full myocardial opacification using real-time imaging at very low emission power (a) (MI = 0.09). After destruction of the microbubbles by a short period of high power imaging (b) (MI = 1.3) myocardial contrast replenishment is recorded at low emission power (c–e) (MI = 0.09). A region of interest (ROI) is placed in the septum and repeated measurements are made at the endsystolic frames. The graph shows the reperfusion curve for this ROI, fitting well to the monoexponential function.


Keywords: Contrast agentechocardiographyEchokardiographieKontrastmittelreperfusionreperfusion


copyright © 2000–2025 Krause & Pachernegg GmbH | Sitemap | Datenschutz | Impressum
 
Werbung