Vitamin D
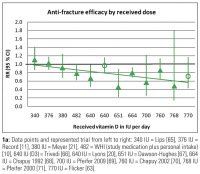
Abbildung 1a-b: 1a: Data points and represented trial from left to right: 340 IU = Lips [65], 376 IU =
Record [11], 380 IU = Meyer [21], 482 = WHI (study medication plus personal intake)
[10], 640 IU (D3) = Trivedi [66], 640 IU = Lyons [20], 651 IU = Dawson-Hughes [67], 664
IU = Chapuy 1992 [68], 700 IU = Pfeifer 2009 [69], 760 IU = Chapuy 2002 [70], 768 IU
= Pfeifer 2000 [71], 770 IU = Flicker [63].
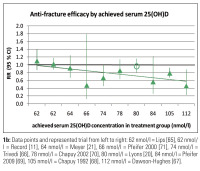
1b: Data points and represented trial from left to right: 62 nmol/l = Lips [65], 62 nmol/
l = Record [11], 64 nmol/l = Meyer [21], 66 nmol/l = Pfeifer 2000 [71], 74 nmol/l =
Trivedi [66], 78 nmol/l = Chapuy 2002 [70], 80 nmol/l = Lyons [20], 84 nmol/l = Pfeifer
2009 [69], 105 nmol/l = Chapuy 1992 [68], 112 nmol/l = Dawson-Hughes [67].
Figure 1a, b: Prevention of non-vertebral fractures with oral vitamin D and dose dependency: a meta-analysis of randomized controlled trials. Triangles indicate trials with D3,
circles trials with D2. Line = Trendline. All 12 high quality trials were included for the received dose meta-regression (n = 42,279 individuals). For achieved 25(OH)D levels 2 trials
did not provide serum 25(OH)D levels measured in the study population during the trial period [63, 64]. For any non-vertebral fractures, anti-fracture efficacy increased
significantly with higher received dose (meta-regression: Beta = –0.0007; p = 0.003) and higher achieved 25-hydroxyvitamin D levels (meta-regression: Beta = –0.005; p = 0.04)
(adapted from [9]).
Keywords:
chart,
Diagramm,
Mineralstoffwechsel,
Vitamin D


