Sandmann S, Unger T L- and T-type calcium channel blockade - the efficacy of the calcium channel antagonist mibefradil Journal of Clinical and Basic Cardiology 1999; 2 (2): 187-201 PDF Summary Overview
| ||||||||||||||||
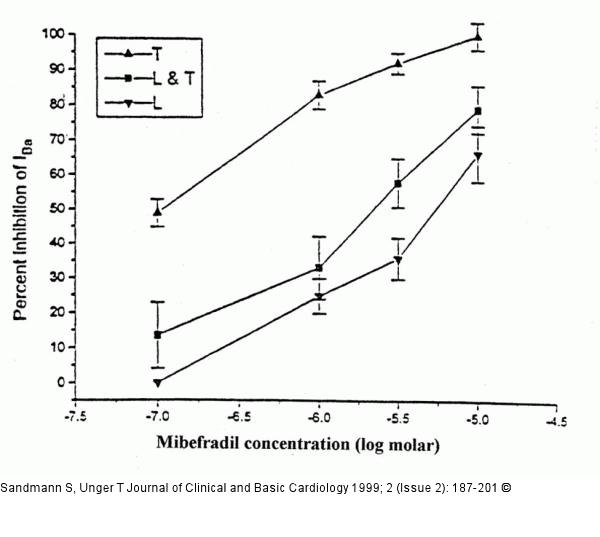
Figure/Graphic 4: Kalziumkanal - Mibefradil Concentration-response curve for the action of mibefradil on vascular muscle Ca2+ currents shows that the actions are more efficacious on T-type currents (T, black triangle, peak up). L indicates L-type currents (black triangle, peak down). Black square indicates L- and T-type currents. These percent inhibitions are based on reductions of the Ba2+ current (IBa) as shown in figure 3, corresponding T to figure 3A, L to figure 3B, and L and T to figure 3C. Data represent mean +/- SEM for 6 to 16 cells at each concentration. |

Figure/Graphic 4: Kalziumkanal - Mibefradil
Concentration-response curve for the action of mibefradil on vascular muscle Ca2+ currents shows that the actions are more efficacious on T-type currents (T, black triangle, peak up). L indicates L-type currents (black triangle, peak down). Black square indicates L- and T-type currents. These percent inhibitions are based on reductions of the Ba2+ current (IBa) as shown in figure 3, corresponding T to figure 3A, L to figure 3B, and L and T to figure 3C. Data represent mean +/- SEM for 6 to 16 cells at each concentration. |


