| |
| Alle Journale wurden nach Elder HY durchsucht |
Treffer 1 - 6 von 6 |
|
|
|---|
1. McGuigan JAS;
Elder HY;
Günzel D;
Schlue W-R
Magnesium Homeostasis in Heart: A Critical Reappraisal
Magnesium - Konzentration
Journal of Clinical and Basic Cardiology 2002; 5 (1): 5-22
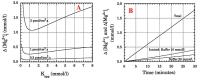
A) Calculation of the change (Delta[Mg2+]) in the [Mg2+]i from the resting concentration of 0.81 mmol/l as the Kapp of a second buffer system is varied from 0.1 to 8 mmol/l for the three fluxes;
change calculated after a 10 minute time interval B) Comparison between the change in total Mg2+ (Delta[Mg]t) and the ionized (Delta[Mg2+]i). Changes in ionized, calculated for two buffer concentrations and with a Kapp of 0.8 mmol/l for second buffer system Keywords: Concentration,
Diagramm,
Konzentration,
magnesium,
magnesium
|
|
|
2. McGuigan JAS;
Elder HY;
Günzel D;
Schlue W-R
Magnesium Homeostasis in Heart: A Critical Reappraisal
Magnesium - Konzentration
Journal of Clinical and Basic Cardiology 2002; 5 (1): 5-22
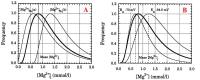
A) Frequency distribution of measured [Mg2+]i from [1] is shown as thick line. The curve labelled "a" is the distribution that would allow a Na+/Mg2+ exchanger to efflux Mg2+ at every measured [Mg2+]i, the curve labelled "b" and to the right of the measured frequency distribution would be influxing Mg2+ B) As in A the thick line is the frequency distribution of the measured [Mg2+]i. To illustrate the effect of membrane potential (Em) on a 1 Na+/1 Mg2+ exchanger the distribution of [Mg2+]Eq for two Em values, namely
-70 mV, the lowest acceptable Em value and –84.8 mV, a value 1 SD more negative than the mean Em value from these experiments Keywords: Ausstrom,
Concentration,
Diagramm,
Efflux,
Einstrom,
frequency,
Influx,
Konzentration,
magnesium,
magnesium
|
|
|
3. McGuigan JAS;
Elder HY;
Günzel D;
Schlue W-R
Magnesium Homeostasis in Heart: A Critical Reappraisal
Herzzellen - Magnesiumefflux
Journal of Clinical and Basic Cardiology 2002; 5 (1): 5-22
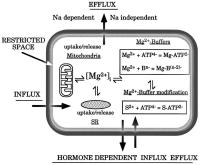
Diagram of a heart cell, illustrating influx, possible efflux pathways, subcellular or "fuzzy space" as well as various possibilities for maintaining [Mg2+]i constant through uptake/release from organelles and buffering. Possible hormonal regulation is also
included. Modified from Lüthi et al. [65] Keywords: Ausstrom,
Cell,
Efflux,
Efflux,
heart,
Herz,
magnesium,
magnesium,
Schema,
Zelle
|
|
|
4. McGuigan JAS;
Elder HY;
Günzel D;
Schlue W-R
Magnesium Homeostasis in Heart: A Critical Reappraisal
Magnesiummakroelektrode - Kalibrierung
Journal of Clinical and Basic Cardiology 2002; 5 (1): 5-22
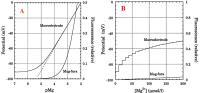
A) Calibration curves for Mg2+-macroelectrode (ETH 7025) and mag-fura-2. The curve for the macroelectrode is based on Figure 2A of Lüthi et al. [31]. The dashed line represents the Nernstian
response. The calibration curve for mag-fura is drawn for one wavelength using a Kd of 5.3 mmol/l at room temperature [1] B) Response of the Mg2+-macroelectrode and mag-fura-2 for 10 micromol/l increases in [Mg2+] calculated from the respective calibration curves Keywords: Calibration,
Diagramm,
Kalibrierung,
Macroelectrode,
magnesium,
magnesium,
Makroelektrode
|
|
|
5. McGuigan JAS;
Elder HY;
Günzel D;
Schlue W-R
Magnesium Homeostasis in Heart: A Critical Reappraisal
Magnesiumefflux - Atrium
Journal of Clinical and Basic Cardiology 2002; 5 (1): 5-22
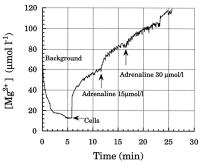
Preliminary measurements of Mg2+ efflux from cultured atrial cells. The background solution contained in mmol/l: Na+, 155; K+, 5; Ca2+, 0.9; and no added Mg2+, buffered to pH 7.4 with 5 mmol/l HEPES. After 6 minutes the cell pellet was added to the background solution. Because of contamination this increased the [Mg2+] from around 15 micromol/l to 60 micromol/l. Addition of adrenaline caused an efflux of Mg2+ from the cells. The electrode did not react to 30 micromol/l adrenaline Keywords: Atrium,
Atrium,
Cell,
Diagramm,
Efflux,
Efflux,
magnesium,
magnesium,
Zelle
|
|
|
6. McGuigan JAS;
Elder HY;
Günzel D;
Schlue W-R
Magnesium Homeostasis in Heart: A Critical Reappraisal
Ionen - Magnesium
Journal of Clinical and Basic Cardiology 2002; 5 (1): 5-22
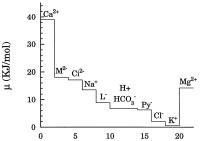
1. Chemical potential for the ionic gradients. The organic anions, malate, citrate, lactate and pyruvate are labelled M2-, Ci2-, L- and Py- respectively. This illustrates that due to the difference in the chemical potential between that required to extrude Mg2+ and that of Cl- and K+ these ions a priori would be unlikely to form a
symport with Mg2+ Keywords: Diagramm,
Ion,
Ion,
magnesium,
magnesium
|
|
|
| |
|

 Suche Medizinische Publikationen
 Suche Abbildungen und Grafiken
 Medizinprodukte - Labortechnik
 Antidotarium (Stand 2012)
 Phytokodex (Stand 2012)
 Fachbücher
 Patientenliteratur