Content-type: text/html Suchergebnis - Abbildungen und Graphiken
Krause und Pachernegg
Verlag für Medizin und Wirtschaft
Mobile Version
A-  |   A  |   A+
Werbung
 
Suchergebnis - Abbildungen und Graphiken
 
Alle Journale wurden nach Feng W durchsucht Treffer 1 - 5 von 5

Medizinische Publikationen (1)  ::   Abbildungen und Graphiken  ::   Volltext (0)

Neue Suche:         Erweiterte Suche    Hilfe zur Suche

in allen Journalen nach  Bildtitel    Bildkeywords   Bildsummary   Autoren      Mindestens ein Wort  Alle Wörter   
1. Tamse CT; Lu X; Mortel EG; Cabrales E; Feng W; Schaefer S
The Peripheral Benzodiazepine Receptor Modulates Ca2+Transport through the VDAC in Rat Heart Mitochondria
VDAC-PBR-ANT
Journal of Clinical and Basic Cardiology 2008; 11 (1-4): 24-29
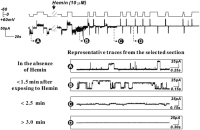
Current amplitude histograms of a VDAC-PBR-ANT channel complex reconstituted in lipid bilayer as exposure to defined concentrations of hemin. A the holding potential of –40 mV (on trans), VDAC-PBR-ANT stayed more frequently at maximal open state. Addition of 2.5, 5 and 10 μM hemin in the cis chamber promoted reduced current amplitudes to a lower and eventually zero value.

Keywords: schemeVDAC-PBR-ANT
2. Tamse CT; Lu X; Mortel EG; Cabrales E; Feng W; Schaefer S
The Peripheral Benzodiazepine Receptor Modulates Ca2+Transport through the VDAC in Rat Heart Mitochondria
VDAC-PBR-ANT
Journal of Clinical and Basic Cardiology 2008; 11 (1-4): 24-29
Representative current traces of VDAC-PBR-ANT channel complex in lipid bilayers. Under control conditions, VDAC-PBR-ANT isolates exhibited characteristic changes in conductance with applied voltages (Section A). Following exposure to hemin 5–10 μM, there was gradual disappearance of conductance changes, resulting in complete channel closure after ~ 3 min (n = 7). The top trace depicts the voltage protocol used for the corresponding current.

Keywords: schemeVDAC-PBR-ANT
3. Tamse CT; Lu X; Mortel EG; Cabrales E; Feng W; Schaefer S
The Peripheral Benzodiazepine Receptor Modulates Ca2+Transport through the VDAC in Rat Heart Mitochondria
Calcium release
Journal of Clinical and Basic Cardiology 2008; 11 (1-4): 24-29
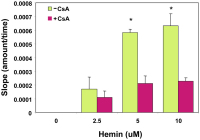
Rate of calcium release (AU/sec) from isolated mitochondria as indicated by an increase in APIII absorbance signal following calcium loading in the absence and presence of CsA under different hemin concentrations (n = 7). There was no calcium release under control conditions in the absence of hemin. Calcium release was significantly greater than control in all experiments using hemin 2.5–10 μM with or without CsA (p < 0.01). In addition, calcium release was greater without CsA than with CsA at hemin 5 and 10 μM (*p < 0.05).

Keywords: calciumflowchart
4. Tamse CT; Lu X; Mortel EG; Cabrales E; Feng W; Schaefer S
The Peripheral Benzodiazepine Receptor Modulates Ca2+Transport through the VDAC in Rat Heart Mitochondria
Calcium Uptake - Calcium Amount
Journal of Clinical and Basic Cardiology 2008; 11 (1-4): 24-29
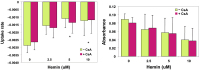
a) Net calcium uptake rate (AU/sec) and b) calcium amount (AU) during the initial transport of calcium into mitochondria (uptake in Figure 1) as a function of [hemin] (2.5–10 μM) in the absence and presence of CsA (n = 7). *p < 0.05 vs control.

Keywords: calciumflowchart
5. Tamse CT; Lu X; Mortel EG; Cabrales E; Feng W; Schaefer S
The Peripheral Benzodiazepine Receptor Modulates Ca2+Transport through the VDAC in Rat Heart Mitochondria
Calcium Kinetics
Journal of Clinical and Basic Cardiology 2008; 11 (1-4): 24-29
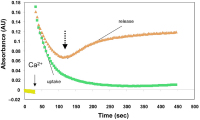
A representative tracing of extra-mitochondrial calcium kinetics following the addition of 60 μM Ca2+ into a solution containing isolated cardiac mitochondria and the calcium-sensitive marker APIII. The absorbance (AU) increased rapidly with the addition of Ca2+ (solid arrow), followed by a decline representing uptake of calcium by mitochondria. The slope and magnitude of this decline was quantified as calcium uptake rate and amount. Following mitochondrial loading with calcium, an increase in AU reflected calcium release by mitochondria (dashed arrow). Calcium release was quantified as the slope of this line, and was partially inhibited by CsA. The lower trace (no hemin) shows rapid uptake of calcium and an absence of release following loading. The upper trace (hemin = 10 μM) illustrates a reduction in calcium loading as well as early release.

Keywords: calcium kineticsflowchart
 

 Seite 1 von 1 
 
copyright © 2000–2026 Krause & Pachernegg GmbH | Sitemap | Datenschutz | Impressum
 
Werbung