|
|
|---|
1. Kirsch A;
Kolland M
Arterieller Hypertonus und Adipositas // Arterial hypertension and obesity
Hypertonie bei Adipositas
Journal für Hypertonie - Austrian Journal of Hypertension 2020; 24 (2): 41-44
Faktoren für Hypertonie bei Adipositas – „Take Home Grafik“ Keywords: Adipositas,
arterieller Bluthochdruck,
arterieller Hypertonus,
Hypertonie,
Schema,
Zusammenhang
|
|
|
2. Kirsch A;
Kolland M
Arterieller Hypertonus und Adipositas // Arterial hypertension and obesity
Erhöhter Leptinspiegel
Journal für Hypertonie - Austrian Journal of Hypertension 2020; 24 (2): 41-44
Systemische Auswirkungen von erhöhten Leptinspiegeln (erstellt nach [38–40]) Keywords: Adipositas,
arterieller Hypertonus,
Bluthochdruck,
erhöhter Leptinspiegel,
Hypertonie,
Schema,
systemische Auswirkung
|
|
|
3. Kirsch A;
Kolland M
Arterieller Hypertonus und Adipositas // Arterial hypertension and obesity
Pathogenetische Mechanismen
Journal für Hypertonie - Austrian Journal of Hypertension 2020; 24 (2): 41-44
Schematische Abbildung der pathogenetischen Mechanismen bei Adipositas-assoziiertem arteriellen Hypertonus (mod. nach [8]). POMC – Proopiomelanocortin; RAAS – Renin-Angiotensin-Aldosteron-System; MCR – Minerolokortikoidrezeptor Keywords: Adipositas,
arterieller Bluthochdruck,
arterieller Hypertonus,
Hypertonie,
MCR,
pathogenetischer Mechanismus,
POMC,
RAAS,
Schema
|
|
|
4. Kirsch A;
Kolland M
Arterieller Hypertonus und Adipositas // Arterial hypertension and obesity
Klassische Risikofaktoren
Journal für Hypertonie - Austrian Journal of Hypertension 2020; 24 (2): 41-44
Klassische Risikofaktoren für arteriellen Bluthochdruck Keywords: arterieller Bluthochdruck,
Hypertonie,
Risikofaktor,
Schema
|
|
|
5. Uckermann O;
Galli R;
Mackenroth L;
Geiger K;
Steiner G;
Koch E;
Schackert G;
Kirsch M
Optical Biochemical Imaging: Potential New Applications in Neuro-Oncology
NLO imaging
European Association of NeuroOncology Magazine 2014; 4 (1): 20-26
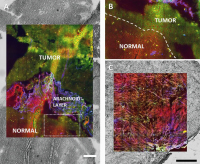
Multimodal NLO imaging of human tumours (red: CARS, green: TPEF, blue: SHG), overlaid with the bright field images of the unstained sample. The technique allows to retrieve detailed morphochemical information about tissue structure and properties on unstained samples. (a) Cryosection of human glioblastoma (scale bar: 200 μm). (b) High magnification of the border between tumour and normal tissue as indicated in (a). (c) Cryosection of human neuroma (scale bar: 0.5 mm). Keywords: NLO imaging,
nonlinear optical microscopy
|
|
|
6. Uckermann O;
Galli R;
Mackenroth L;
Geiger K;
Steiner G;
Koch E;
Schackert G;
Kirsch M
Optical Biochemical Imaging: Potential New Applications in Neuro-Oncology
Multimodal NLO
European Association of NeuroOncology Magazine 2014; 4 (1): 20-26
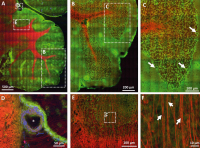
Multimodal NLO imaging of a mouse cerebellum (red: CARS, green: TPEF, blue: SHG). (a) Overview of the mouse cerebellum. (b) Magnification of the area indicated in (a). (c) Magnification of the area indicated in (b). Arrows indicate Purkinje cells characterized by punctuate fluorescence in the somata. (d) Magnification of
the area indicated in (a), a large blood vessel is shown (*). (e) Magnification of the area indicated in (a), nerve fibres are indicated by intense CARS signal. (f) Magnification of the area indicated in (e). Single axons can be discerned (arrows). Keywords: NLO imaging,
nonlinear optical microscopy
|
|
|
7. Uckermann O;
Galli R;
Mackenroth L;
Geiger K;
Steiner G;
Koch E;
Schackert G;
Kirsch M
Optical Biochemical Imaging: Potential New Applications in Neuro-Oncology
CARS image
European Association of NeuroOncology Magazine 2014; 4 (1): 20-26
CARS microscopy of infiltrative experimental
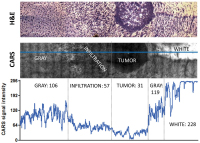
glioblastoma in a mouse model: The intensity of the CARS image and the morphological details permit to distinguish between the tumour mass, the infiltrative area, and the normal brain grey and white matters. H&E staining (top) CARS image (centre). The intensity of the CARS signal along the blue line is plotted in the graph (bottom). Mean intensity values for the different types of tissue are also reported. Mean intensity that characterizes the normal grey tissue is reduced to approximately 50 % in the infiltrative area and to approximately 30 % in the tumour. Lipid rich white matter is characterized by high CARS signal intensity (228, saturation in some areas). Keywords: CARS image,
scheme
|
|
|
8. Uckermann O;
Galli R;
Mackenroth L;
Geiger K;
Steiner G;
Koch E;
Schackert G;
Kirsch M
Optical Biochemical Imaging: Potential New Applications in Neuro-Oncology
FT-IR imaging
European Association of NeuroOncology Magazine 2014; 4 (1): 20-26
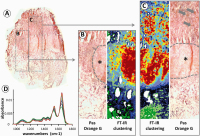
FT-IR imaging of human pituitary adenoma. (a) Overview of a cryosection of human pituitary adenoma stained using Pas-Orange-G and illustrating the production of human growth hormone (HGH). (b, c) High magnification of the areas indicated in (a) and corresponding FT-IR spectroscopic images obtained by cluster analysis. Large areas with increased HGH production are indicated by asterisks, local spots of hormone production are marked by arrows. (d) Representative spectra corresponding to area (b). Keywords: FT-IR imaging,
human pituitary adenoma,
scheme
|
|
|
9. Uckermann O;
Galli R;
Mackenroth L;
Geiger K;
Steiner G;
Koch E;
Schackert G;
Kirsch M
Optical Biochemical Imaging: Potential New Applications in Neuro-Oncology
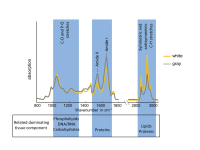
Vibrational Spectroscopy
European Association of NeuroOncology Magazine 2014; 4 (1): 20-26
FT-IR spectra of grey and white matters of nervous tissue. The main bond vibrations and related dominating tissue components are indicated. Keywords: FT-IR spectra,
scheme,
vibrational spectroscopy
|
|
|
| |

 Suche Medizinische Publikationen
 Suche Abbildungen und Grafiken
 Medizinprodukte - Labortechnik
 Antidotarium (Stand 2012)
 Phytokodex (Stand 2012)
 Fachbücher
 Patientenliteratur