| Gasser R et al. |
|---|
Differential Gene Expression und Nebivolol and Atenolol during Experimental Ischemia in Human Myocardium
Journal of Clinical and Basic Cardiology 2008; 11 (1-4): 16-23
PDF Summary Figures
| Figure |
|---|
| |
|
|
Micriarray experiments
Figure 1: Typical results derived from microarray experiments. Light intensities on the microtiter plate reflect gene expression.
Keywords: light intensities
|
| |
| |
|
|
Atenolol - Nebivolol
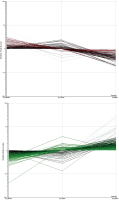
Figure 2: Panels A und B show all genes regulated by either atenolol or nebivolol under non-ischemic, well-oxygenated conditions. Panel
A (red) summarizes all genes down-regulated by nebivolol compared to those up-regulated by atenolol during normoxia. Hence, panel A demonstrates the direct influence of atenolol and nebivolol
on gene expression in well-oxygenated preparations. It can easily be seen that, under optimal conditions, without any sign of ischemia/hypoxia, the effect of nebivolol upon gene expression is quite different
from that of atenolol. O2 control indicates gene expression in well-oxygenated preparations without betablockers. O2 nebivolol indicates gene expression in the presence of nebivolol in non-ischemic,
well-oxygenated preparations. The red and green lines indicate the direction of gene regulation. On the left side of panel A, O2 atenolol represents genes differentially expressed under atenolol during control
conditions. Panel B, accordingly, shows all genes up-regulated by nebivolol which are down-regulated by atenolol (O2 control here also representing untreated controls).
Keywords: Atenolol,
Nebivolol
|
| |
| |
|
|
Hypoxia
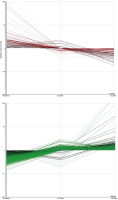
Figure 3: Panels A und B show all genes regulated significantly during experimental myocardial ischemia (hypoxia) in the presence and absence of either atenolol or nebivolol. Panel A (red) summarizes all
genes down-regulated by nebivolol compared to those up-regulated by atenolol during hypoxia. N2 control indicates gene expression in ischemic preparations without betablockers. N2 nebivolol indicates gene expression in the presence of nebivolol in ischemic preparations.
The red and green lines indicate the direction of gene regulation. On the left side of panel A, N2 atenolol represents genes upregulated under atenolol during hypoxia. Panel B, accordingly, shows all genes up-regulated by nebivolol which are down-regulated
by atenolol (N2 control here also representing non-treated controls).
Keywords: Atenolol,
hypoxia,
Nebivolol
|
| |
| |
|
|
Nebivolol - Atenolol
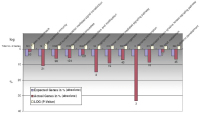
Figure 4: This figure shows biological processes more than twofold downregulated in the presence of nebivolol but unaffected by atenolol during simulated ischemia (100 % O2 replaced by 100 % N2 perfusion). One can
see that, in particular on the level of reverse transcription and T-cell-mediated immunity as well as in the process of angiogenesis, a noteworthy regulation
is brought about by nebivolol.
Keywords: Atenolol,
flowchart,
Nebivolol
|
| |
| |
|
|
Nebivolol - Atenolol
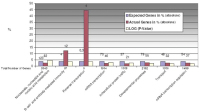
Figure 5: Similarly, as in Figure 4, biological processes involved in cell-mediated immunity and reverse transcription are significantly up-regulated by nebivolol and not by atenolol. One may deduce that both cellular immunity
as well as reverse transcription are regulated by nebivolol at various sites.
Keywords: Atenolol,
flowchart,
Nebivolol
|
| |
| |
|
|
Biochemical process
Figure 6a-b: In well-oxygenized preparations, we can see that numerous biochemical processes, mainly those involved in signalling and cellular immunity, are affected by nebivolol but not by atenolol. In the lower part, we can see that many processes involved in contraction, lipid metabolism, and proliferation are down-regulated by nebivolol only (not by atenolol). This kind of
processes, if slowed down, may render the heart less vulnerable to O2 deficit or ischemia.
Keywords: biochemical process,
flowchart
|
| |
| |
|
|
Well-oxygenized preparations
Figure 7a-b: In well-oxygenized preparations, we can see that numerous biochemical processes are up-regulated by nebivolol (not by atenolol). Interesting are reverse transcription, stress response, and protein phosphorylation.
Keywords: biochemical process,
flowchart
|
| |
| |
|
|
Gene expression
Figure 8: It is interesting that nebivolol but not atenolol leads to a downregulation of gene expression in glutamine-glutamate conversion and pyruvate
metabolism, the latter of particular interest in ischemia.
Keywords: Atenolol,
flowchart,
gene expression,
Nebivolol
|
| |
| |
|
|
Biological Pathways
Figure 9a-b: In well-oxygenized preparations, we can see that numerous biological pathways, mainly those involved in signalling, angiogenesis, cellular immunity, and EGF are affected by nebivolol but not by atenolol.
Keywords: Atenolol,
biological pathway,
flowchart,
Nebivolol
|
| |
| |
|
|
Pathway - Up-Regulation
Figure 10: Generally, we could see that, during experimental ischemia, upregulation of pathways is minimal by nebivolol over atenolol. This becomes
evident in Figure 9a, only 3 pathways are affected. However, the interleukin signalling pathway may be of interest in connection with inflammation, scarring
and remodelling.
Keywords: Atenolol,
flowchart,
ischaemia,
Nebivolol
|
| |
| |
|
|
Nebivolol - Biological Pathway
Figure 11: Concerning nebivolol-regulated biological pathways, we could see that, during normoxia, up-regulation of pathways is hardly pronounced by nebivolol over atenolol. This becomes evident also in Figure 9a, only 3
pathways are affected here. Noteworthy here, too, the interleukin signalling pathway.
Keywords: Atenolol,
flowchart,
Nebivolol
|
| |
| |
|
|

