Gasser R, Ablasser K, Roessl U, Kraigher-Krainer E, Lewinski D, Mangge H, Mächler H, Trantina-Yates A, Tscheliessnigg KH, Udermann H, Porta S, Friehs I, Scherr E, Brussee H, Gasser S Differential Gene Expression und Nebivolol and Atenolol during Experimental Ischemia in Human Myocardium Journal of Clinical and Basic Cardiology 2008; 11 (1-4): 16-23 PDF Summary Overview
| ||||||||||||||||
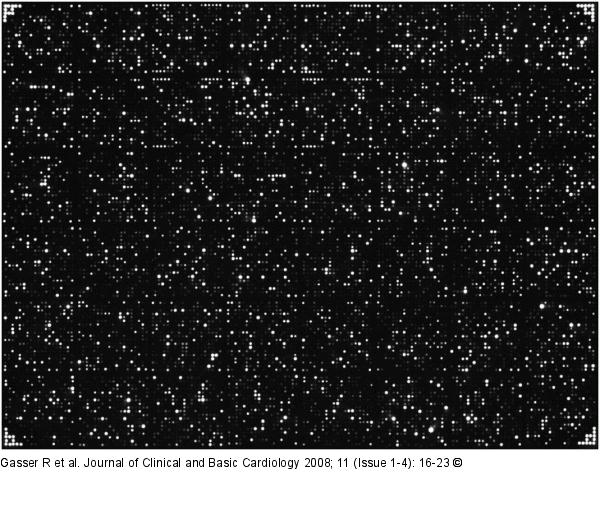
Figure/Graphic 1: Micriarray experiments Typical results derived from microarray experiments. Light intensities on the microtiter plate reflect gene expression. |

Figure/Graphic 1: Micriarray experiments
Typical results derived from microarray experiments. Light intensities on the microtiter plate reflect gene expression. |


