Gasser R, Ablasser K, Roessl U, Kraigher-Krainer E, Lewinski D, Mangge H, Mächler H, Trantina-Yates A, Tscheliessnigg KH, Udermann H, Porta S, Friehs I, Scherr E, Brussee H, Gasser S Differential Gene Expression und Nebivolol and Atenolol during Experimental Ischemia in Human Myocardium Journal of Clinical and Basic Cardiology 2008; 11 (1-4): 16-23 PDF Summary Overview
| ||||||||||||||||
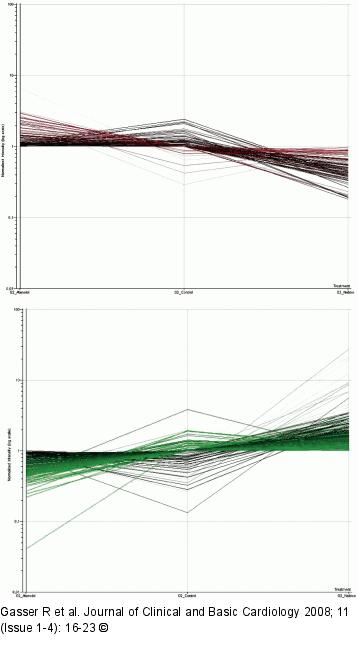
Figure/Graphic 2: Atenolol - Nebivolol Panels A und B show all genes regulated by either atenolol or nebivolol under non-ischemic, well-oxygenated conditions. Panel A (red) summarizes all genes down-regulated by nebivolol compared to those up-regulated by atenolol during normoxia. Hence, panel A demonstrates the direct influence of atenolol and nebivolol on gene expression in well-oxygenated preparations. It can easily be seen that, under optimal conditions, without any sign of ischemia/hypoxia, the effect of nebivolol upon gene expression is quite different from that of atenolol. O2 control indicates gene expression in well-oxygenated preparations without betablockers. O2 nebivolol indicates gene expression in the presence of nebivolol in non-ischemic, well-oxygenated preparations. The red and green lines indicate the direction of gene regulation. On the left side of panel A, O2 atenolol represents genes differentially expressed under atenolol during control conditions. Panel B, accordingly, shows all genes up-regulated by nebivolol which are down-regulated by atenolol (O2 control here also representing untreated controls). |

Figure/Graphic 2: Atenolol - Nebivolol
Panels A und B show all genes regulated by either atenolol or nebivolol under non-ischemic, well-oxygenated conditions. Panel A (red) summarizes all genes down-regulated by nebivolol compared to those up-regulated by atenolol during normoxia. Hence, panel A demonstrates the direct influence of atenolol and nebivolol on gene expression in well-oxygenated preparations. It can easily be seen that, under optimal conditions, without any sign of ischemia/hypoxia, the effect of nebivolol upon gene expression is quite different from that of atenolol. O2 control indicates gene expression in well-oxygenated preparations without betablockers. O2 nebivolol indicates gene expression in the presence of nebivolol in non-ischemic, well-oxygenated preparations. The red and green lines indicate the direction of gene regulation. On the left side of panel A, O2 atenolol represents genes differentially expressed under atenolol during control conditions. Panel B, accordingly, shows all genes up-regulated by nebivolol which are down-regulated by atenolol (O2 control here also representing untreated controls). |


