Calcium Kinetics
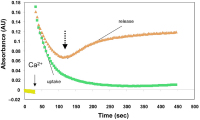
Figure 1: A representative tracing of extra-mitochondrial calcium kinetics following the addition of 60 μM Ca2+ into a solution containing isolated cardiac mitochondria and the calcium-sensitive marker
APIII. The absorbance (AU) increased rapidly with the addition of Ca2+ (solid arrow), followed by a decline representing uptake of calcium
by mitochondria. The slope and magnitude of this decline was quantified as calcium uptake rate and amount. Following mitochondrial loading with calcium, an increase in AU reflected calcium release
by mitochondria (dashed arrow). Calcium release was quantified as the slope of this line, and was partially inhibited by CsA. The lower trace (no hemin) shows rapid uptake of calcium and an absence of release following loading. The upper trace (hemin = 10 μM) illustrates a reduction in calcium loading as well as early release.
Keywords:
calcium kinetics,
flowchart


