Krause und Pachernegg
Verlag für Medizin und Wirtschaft
Artikel   Bilder   Volltext

Mobile Version
A-  |   A  |   A+
Werbung
 
Figures and Graphics
Gasser R et al.  
Shift from Adult to Fetal Metabolic Phenotype During Prolonged Experimental Myocardial Ischemia: A Study on the Effect of Beta Blockers upon Gene Expression of Transmembrane Glucose Transporters

Journal of Clinical and Basic Cardiology 2009; 12 (1-4): 11-17

PDF    Summary    Figures   


Figure
 
Real-time PCR
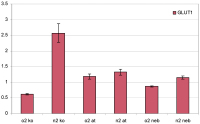
Figure 1: Results from real-time PCR measurements of 72 experiments (n = 12 in each group; o2ko = well-oxygenated, no ischemia, no drug; n2ko = experimental ischemia, no drug; o2at = well-oxygenated, no ischemia, atenolol present; n2at = experimental ischemia, atenolol present; o2neb = well-oxygenated, nebivolol present; n2neb = experimental ischemia, nebivolol present). It can be seen that during experimental ischemia, there is an up-regulation of GLUT1 expression, however, not statistically significant. This confirms earlier data by our group. While there is no significant regulation with and without the influence of beta blockers during myocardial ischemia either, there is, however, a significant difference between the expression of GLUT1 in well-oxygenized preparations with (0.87 ± 0.02) and without nebivolol (0.62 ± 0.02; ± SEM; p ≤ 0.05). Similarly, atenolol led to an increase of GLUT1 expression in welloxygenated preparations compared to controls: 1.18 ± 0.08 and 0.62 ± 0.02, respectively (+ SEM; p < 0.05)


Keywords: chartDiagramm
 
 
Real-time PCR
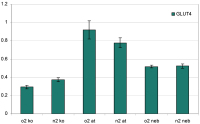
Figure 2: Results from real-time PCR measurements of all GLUT4 experiments (o2ko = well-oxygenated, no ischemia, no drug; n2ko = experimental ischemia, no drug; o2at = well-oxygenated, no ischemia, atenolol present; n2at = experimental ischemia, atenolol present; o2neb = well-oxygenated, nebivolol present; n2neb = experimental ischemia, nebivolol present). It can be seen that during experimental ischemia, there is an up-regulation of GLUT4 (SLC2A4) expression, however not statistically significant.


Keywords: chartDiagramm
 
 
Myocardial Metabolism
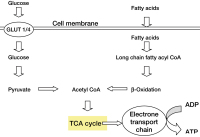
Figure 3: Substrates of myocardial metabolism. Mod. from [29, 32]. The fetal myocardial phenotype uses predominantly glucose for its metabolism, whereas the adult individual mainly metabolises fatty acids. During special conditions, like hypoxia, the adult phenotype of myocardial metabolism converts to the fetal phenotype, again preferably using glucose for its metabolism (Fig. 4). It has been shown that a preferentially glucose-oriented cardiac metabolism is beneficial in myocardial ischemia. However, knockout experiments have shown that successful transfer to the fetal metabolism is possible only under adequate/increased GLUT1 expression [33–35].


Keywords: chartDiagramm
 
 
Glucose metabolism
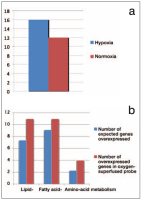
Figure 4a-b: (a) Gene expression of biological processes associated with glucose metabolism during normoxia and hypoxia. Up-regulation of glucose metabolism. (b) Down-regulation of gene expression of biological processes associated with fatty acid and amino acid metabolism – (a) and (b) indicate a conversion to the fetal type of metabolism. Based on data from [4–9, 32–35].


Keywords: chartDiagramm
 
 
Cardiac metabolism
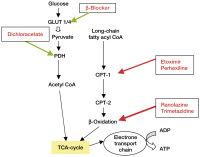
Figure 5: Shifting cardiac metabolism to its fetal phenotype: as an anti-anginal target (mod. from [32]) of dichloracetate augments cellular glucose metabolism. Etoximir and perhexiline inhibit cellular fatty acid metabolism and both ranolazine as well as trimetazidine slow down beta oxidation. Beta-adrenergic blockade enhances GLUT1 and GLUT4 expressions.


Keywords: Schemascheme
 
 
Myocardial Metabolism
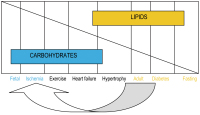
Figure 6: Plasticity of myocardial metabolism: during exercise, hypoxia/ ischemia etc myocardial cells prefer glucose as a substrate. Both fasting and diabetes shift the metabolic substrates to the fatty acid site. Mod. from [29, 33].


Keywords: chartDiagramm


copyright © 2000–2025 Krause & Pachernegg GmbH | Sitemap | Datenschutz | Impressum
 
Werbung