McGuigan JAS, Elder HY, Günzel D, Schlue W-R Magnesium Homeostasis in Heart: A Critical Reappraisal Journal of Clinical and Basic Cardiology 2002; 5 (1): 5-22 PDF Summary Overview
| ||||||||||||
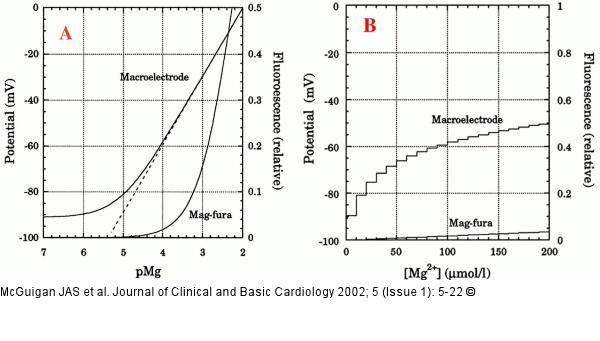
Figure/Graphic 3A-B: Magnesiummakroelektrode - Kalibrierung A) Calibration curves for Mg2+-macroelectrode (ETH 7025) and mag-fura-2. The curve for the macroelectrode is based on Figure 2A of Lüthi et al. [31]. The dashed line represents the Nernstian response. The calibration curve for mag-fura is drawn for one wavelength using a Kd of 5.3 mmol/l at room temperature [1] B) Response of the Mg2+-macroelectrode and mag-fura-2 for 10 micromol/l increases in [Mg2+] calculated from the respective calibration curves |

Figure/Graphic 3A-B: Magnesiummakroelektrode - Kalibrierung
A) Calibration curves for Mg2+-macroelectrode (ETH 7025) and mag-fura-2. The curve for the macroelectrode is based on Figure 2A of Lüthi et al. [31]. The dashed line represents the Nernstian response. The calibration curve for mag-fura is drawn for one wavelength using a Kd of 5.3 mmol/l at room temperature [1] B) Response of the Mg2+-macroelectrode and mag-fura-2 for 10 micromol/l increases in [Mg2+] calculated from the respective calibration curves |


