McGuigan JAS, Elder HY, GŁnzel D, Schlue W-R Magnesium Homeostasis in Heart: A Critical Reappraisal Journal of Clinical and Basic Cardiology 2002; 5 (1): 5-22 PDF Summary Overview
| ||||||||||||
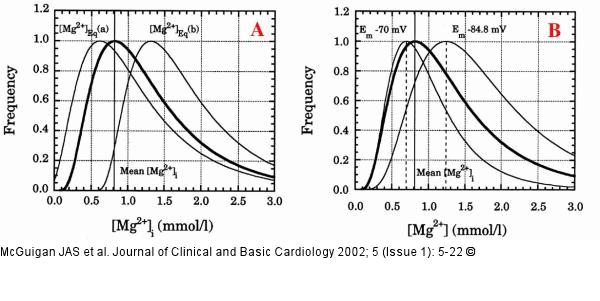
Figure/Graphic 5A-B: Magnesium - Konzentration A) Frequency distribution of measured [Mg2+]i from [1] is shown as thick line. The curve labelled "a" is the distribution that would allow a Na+/Mg2+ exchanger to efflux Mg2+ at every measured [Mg2+]i, the curve labelled "b" and to the right of the measured frequency distribution would be influxing Mg2+ B) As in A the thick line is the frequency distribution of the measured [Mg2+]i. To illustrate the effect of membrane potential (Em) on a 1 Na+/1 Mg2+ exchanger the distribution of [Mg2+]Eq for two Em values, namely -70 mV, the lowest acceptable Em value and –84.8 mV, a value 1 SD more negative than the mean Em value from these experiments |

Figure/Graphic 5A-B: Magnesium - Konzentration
A) Frequency distribution of measured [Mg2+]i from [1] is shown as thick line. The curve labelled "a" is the distribution that would allow a Na+/Mg2+ exchanger to efflux Mg2+ at every measured [Mg2+]i, the curve labelled "b" and to the right of the measured frequency distribution would be influxing Mg2+ B) As in A the thick line is the frequency distribution of the measured [Mg2+]i. To illustrate the effect of membrane potential (Em) on a 1 Na+/1 Mg2+ exchanger the distribution of [Mg2+]Eq for two Em values, namely -70 mV, the lowest acceptable Em value and –84.8 mV, a value 1 SD more negative than the mean Em value from these experiments |


