Content-type: text/html Suchergebnis - Abbildungen und Graphiken
Krause und Pachernegg
Verlag für Medizin und Wirtschaft
Mobile Version
A-  |   A  |   A+
Werbung
 
Suchergebnis - Abbildungen und Graphiken
 
Alle Journale wurden nach Dellacher A durchsucht Treffer 1 - 3 von 3

Medizinische Publikationen (1)  ::   Abbildungen und Graphiken  ::   Volltext (0)

Neue Suche:         Erweiterte Suche    Hilfe zur Suche

in allen Journalen nach  Bildtitel    Bildkeywords   Bildsummary   Autoren      Mindestens ein Wort  Alle Wörter   
1. Gasser R; Gasser S; Ablasser K; Scherr E; Roessl U; Lewinski D; Mangge H; Dellacher A; Mächler H; Trantina-Yates A; Tscheliessnigg KH
Quantification of GLUT4 Gene Expression in Human Atrial Myocardium of Hypertensive Patients and the Effect of Experimental Ischaemia Thereupon
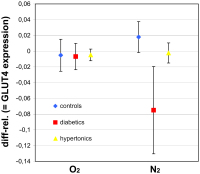
Expression of GLUT4
Journal of Clinical and Basic Cardiology 2007; 10 (1-4): 1-6
Relative difference in the expression of GLUT4 under ischaemic and non-ischaemic conditions (n = 8; ± SEM) in hypertensive, diabetic and control subjects. Results show slight trends in GLUT4 mRNA expression, however no statistical significance could be seen in either group.

Keywords: DiagrammflowchartGLUT4ischaemiaIschämie
2. Gasser R; Gasser S; Ablasser K; Scherr E; Roessl U; Lewinski D; Mangge H; Dellacher A; Mächler H; Trantina-Yates A; Tscheliessnigg KH
Quantification of GLUT4 Gene Expression in Human Atrial Myocardium of Hypertensive Patients and the Effect of Experimental Ischaemia Thereupon
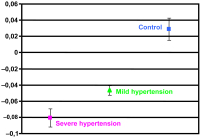
Hypertensive Patients
Journal of Clinical and Basic Cardiology 2007; 10 (1-4): 1-6
Mean ± SEM of the relative myocardial cellular GLUT4 gene expression in the three tested groups displays clearly the lower GLUT4 expression in hypertensive patients directly snap-frozen during cardiac surgery, not equilibrated with 100 % O2.

Keywords: DiagrammflowchartGLUT4hypertensionHypertonie
3. Gasser R; Gasser S; Ablasser K; Scherr E; Roessl U; Lewinski D; Mangge H; Dellacher A; Mächler H; Trantina-Yates A; Tscheliessnigg KH
Quantification of GLUT4 Gene Expression in Human Atrial Myocardium of Hypertensive Patients and the Effect of Experimental Ischaemia Thereupon
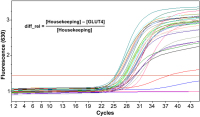
GLUT4
Journal of Clinical and Basic Cardiology 2007; 10 (1-4): 1-6
The amount of cycles needed for the amplification curve to exceed the background fluorescence (dashed line) represents the CT value. The quantity of myocardial cellular GLUT4 gene expression is shown as relative difference, which is calculated from the CT values of the housekeeping and the GLUT4 PCR.

Keywords: amplification curveAmplifikationskurveGLUT4
 

 Seite 1 von 1 
 
copyright © 2000–2026 Krause & Pachernegg GmbH | Sitemap | Datenschutz | Impressum
 
Werbung