2.
Holzmann S;
Dittrich P;
Pöch G
Dose-response curves of vasorelaxants: computerized calculation of combination effects using the example of nicorandil
Dosiswirkungsbeziehung - Nitroprussid
Journal of Clinical and Basic Cardiology 1999; 2 (1): 96-98
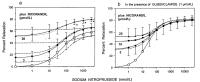
Cumulative dose-response curves (DRCs) of nitroprusside in the absence (open symbol) and presence of 3-20 micromol/L nicorandil (filled symbols), a) in the absence, b) in the presence of 1 micromol/L glibenclamide. The symbols and bars
represent experimental mean values from 12 experiments and 95 % CI. Experimental DRCs are shown by solid lines, theoretical DRCs by dashed lines (dose-additivity) and dotted lines independence). For graphical clarity, the following theoretical curves are shown in a) bands of 95 % CI with upper and lower boundary of dose-additive
combinations of nitroprusside in the presence of 3 and 20 micromol/L nicorandil, curve of mean independent effect of nitroprusside in the presence of 20 micromol/L nicorandil, b) means of dose-additive combinations of nitroprusside with 3, 10, and 20 micromol/L nicorandil. The effects of nicorandil alone are shown on the y-axis. Significant deviation from dose-additivity is indicated by asterics.
Keywords:
Diagramm,
Glibenclamid,
glibenclamide,
Nicorandil,
Nicorandil,
vasorelaxation,
vasorelaxation

 Suche Medizinische Publikationen
 Suche Abbildungen und Grafiken
 Medizinprodukte - Labortechnik
 Antidotarium (Stand 2012)
 Phytokodex (Stand 2012)
 Fachbücher
 Patientenliteratur