| Wicher C, Biewald G-A |
|---|
Left-ventricular dysfunction, heart vagus influences and angiotensin II effects after doxorubicin perfusion in isolated rat hearts
Journal of Clinical and Basic Cardiology 1999; 2 (2): 259-266
PDF Summary Figures
| Figure |
|---|
| |
|
|
Angiotensin II - Vagusstimulation
Figure 1A-B: Effects of angiotensin II on time course of left-ventricular pressure (LVP) and on vagus stimulation effect, recorded in isolated rat hearts (modified Langendorff preparation). Time periods of vagus stimulation (right N. vagus, 10 Hz, 10 V, 10 s stimulation period) are marked by horizontal bars. A: control recording before AII application, B: recording 5 min after addition of 2 micromol/L AII to perfusion solution. Note clear reductions in heart rate and systolic pressure caused by vagus timulation during Tyrode perfusion (A). AII had direct positive chronotropic and inotropic effects and inhibited the vagus stimulation effects (B).
Keywords: Angiotensin II,
Angiotensin II,
Diagramm,
left ventricular pressure,
linksventrikulärer Druck,
Nervus vagus,
Nervus vagus
|
| |
| |
|
|
Doxorubicin - Angiotensin-II-Modulation
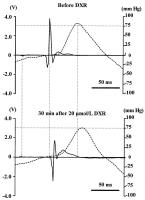
Figure 2: Superimposed single time courses of left-ventricular pressure (LVP, dashed line) and electrocardiogram (ECG, solid line), recorded in isolated rat hearts before (above) and 30 min after addition of 20 micromol/L doxorubicin (DXR, below) to Tyrode solution. P wave was chosen as common origin of the curves. Note that DXR induces a slowing in contraction phase and increases in ECG intervals (PQ and SαT).
Keywords: Angiotensin II,
Angiotensin II,
Diagramm,
doxorubicin,
doxorubicin,
electrocardiography,
Elektrokardiographie,
left ventricular pressure,
linksventrikulärer Druck
|
| |
| |
|
|
Doxorubicin - Angiotensin-II-Modulation
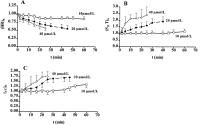
Figure 3A-C: Normalized changes in heart rate (HR, A), SαT (B) time of the ECG and time constant of left-ventricular contraction τC (C) during perfusion of isolated heart with doxorubicin (DXR, 10-40
micromol/L)-containing Tyrode (parameters before DXR addition were set to 1). 10 micromol/L DXR: solid line and open squares, 20 micromol/L DXR: dash-dotted line and filled circles, 40 micromol/L DXR: dashed line and open rhombs. Means and SD of 5 experiments. Note that DXR perfusion caused reductions in heart rate by up to 50 %, and
increases in SαT by up to 150 %, and increase in τC by up to 75 % (after 25 minutes perfusion with 40 micromol/L DXR-containing Tyrode).
Keywords: Angiotensin II,
Angiotensin II,
Diagramm,
doxorubicin,
doxorubicin,
heart rate,
Herzfrequenz
|
| |
| |
|
|
Doxorubicin - Angiotensin-II-Modulation
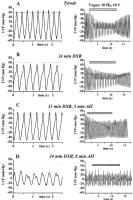
Figure 4A-D: Time courses of left-ventricular pressure (LVP) in isolated rat heart before (left figures) and during vagus stimulation (10 Hz, 10 V, 10 s stimulation period, right figures), recorded during Tyrode perfusion, Tyrode + doxorubicin (DXR) perfusion and Tyrode + DXR + angiotensin II (AII) perfusion. 20 micromol/L DXR and 1 micormol/L AII were applied in this experiment. AII was added 26 minutes after DXR administation. A Tyrode perfusion, B after 24 min perfusion with Tyrode + DXR, C after 5 min perfusion with Tyrode + DXR + AII (31 min after DXR application) and D 3 minutes later than C (after 8 min perfusion with Tyrode + DXR + AII, 34 min after DXR application = end of the experiment). Horizontal bars (right figures) mark the time period of vagus stimulation.
Keywords: Angiotensin II,
Angiotensin II,
Diagramm,
doxorubicin,
doxorubicin,
left ventricular pressure,
linksventrikulärer Druck
|
| |
| |
|
|
Doxorubicin - Angiotensin-II-Modulation
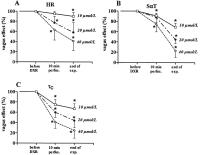
Figure 5A-D: Dose-dependence of the changes in vagus stimulation (right N. vagus, 10 Hz, 10 V) effects
on heart rate (HR, A), SαT time (B) and time constant of contraction τC (C) during perfusion of isolated rat hearts with doxorubicin (DXR)-containing Tyrode. 10 micromol/L DXR: solid line and open squares, 20 micromol/L DXR: dash-dotted line and filled circles, 40 micromol/L DXR: dashed line and open rhombs. Vagus stimulation effects before DXR addition to Tyrode were set to 100 %. Vagus stimulation effects were recorded 10 min after start of DXR perfusion and shortly before the end of each experiment (duration of experiments was the shorter the higher the DXR doses: hearts beated about 60 min after addition of 10 micro mol/L DXR, 40 min after addition of 20 micro mol/L DXR and 25 min after addition of
40 micro mol/L DXR). Means and SD of 5 experiments. Asterisks, significant changes compared with control values before DXR perfusion (P < 0.05).
Keywords: Angiotensin II,
Angiotensin II,
Diagramm,
doxorubicin,
doxorubicin,
heart rate,
Herzfrequenz,
Nervus vagus,
Nervus vagus
|
| |
| |
|
|
Doxorubicin - Angiotensin-II-Modulation
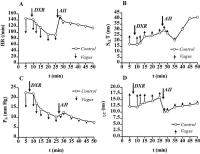
Figure 6A-D: Time courses of heart rate (HR, A), SαT time (B), systolic pressure PS (C) and time constant of contraction τC (D) and changes in above parameters during vagus stimulation (right N. vagus, 10 Hz, 10 V), recorded in an isolated rat heart (modified Langendorff preparation) before and during doxorubicin (DXR) perfusion (20 micromol/L) and after addition of angiotensin II (AII, 1 micro mol/L). AII was added 20 min after DXR application to Tyrode solution. Small vertical arrows which originate from the curves, show changes in the parameters mentioned above, caused by vagus stimulation. Note, that vagus effects were progressively reduced during DXR perfusion. Addition of AII caused positive chronotropic and inotropic effects for a short time. Additionally, AII addition reduced vagus stimulation effects regarding above parameters (especially HR and PS). At the end of experiment, all vagus effects
were nearly completely disappeared.
Keywords: Angiotensin II,
Angiotensin II,
Diagramm,
doxorubicin,
doxorubicin,
heart rate,
Herzfrequenz,
Nervus vagus,
Nervus vagus,
systolic blood pressure,
systolischer Blutdruck
|
| |
| |
|
|
Doxorubicin - Angiotensin-II-Modulation
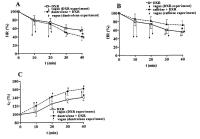
Figure 7A-C: Heart rate (HR, A, B) and time constant of contraction τC (C) during perfusion (for 40 min) of isolated rat hearts with doxorubicin (DXR, 20 micromol/L)-containing Tyrode solution, and after addition of dantrolene (10 micromol/L, A, C) and caffeine (10 mmol/L, B) to DXR-containing Tyrode solution, respectively. Values were normalized on HR or τC of control recording (during Tyrode erfusion). Drugs were applied at the time point "0 min". Means and SD of 5 experiments with DXR perfusion (solid line and open squares in A-C) and of 5 experiments each where a perfusion with dantrolene (A,C) or caffeine (B) + DXR was performed (dashed lines and filled circles). Vagus stimulation (right N. vagus, 10 Hz, 10 V, 10 s stimulation period) effects were recorded in intervals of 10 min starting after drugs administration (the arrows represent HR reductions / τC increases caused each by vagus stimulation. Full line arrows, vagus stimulation effects during DXR perfusion; dashed line arrows, vagus stimulation effects during perfusion with dantrolene/caffeine+DXR containing solution). Note that HR was significantly (P < 0.05, asterisks) reduced (A) / increased (B) after 40 min perfusion with dantrolene+DXR / caffeine+DXR, compared with HR in DXR perfusion experiments. τC was significant increased after 40 min perfusion with dantrolene+DXR, compared with HR in DXR perfusion experiments. Caffeine reduces, dantrolene increases the observed DXR actions regarding HR, τC and vagus stimulation effects.
Keywords: Angiotensin II,
Angiotensin II,
Dantrolen,
dantrolene,
Diagramm,
doxorubicin,
doxorubicin,
heart rate,
Herzfrequenz,
Nervus vagus,
Nervus vagus
|
| |
| |
|
|


