Wicher C, Biewald G-A Left-ventricular dysfunction, heart vagus influences and angiotensin II effects after doxorubicin perfusion in isolated rat hearts Journal of Clinical and Basic Cardiology 1999; 2 (2): 259-266 PDF Summary Overview
| ||||||||||||||||
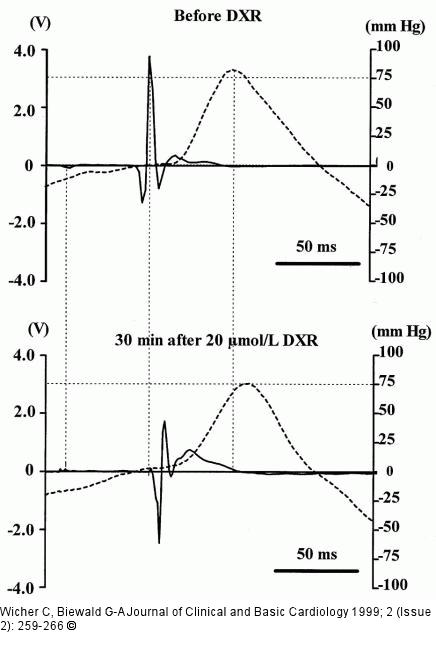
Figure/Graphic 2: Doxorubicin - Angiotensin-II-Modulation Superimposed single time courses of left-ventricular pressure (LVP, dashed line) and electrocardiogram (ECG, solid line), recorded in isolated rat hearts before (above) and 30 min after addition of 20 micromol/L doxorubicin (DXR, below) to Tyrode solution. P wave was chosen as common origin of the curves. Note that DXR induces a slowing in contraction phase and increases in ECG intervals (PQ and SαT). |

Figure/Graphic 2: Doxorubicin - Angiotensin-II-Modulation
Superimposed single time courses of left-ventricular pressure (LVP, dashed line) and electrocardiogram (ECG, solid line), recorded in isolated rat hearts before (above) and 30 min after addition of 20 micromol/L doxorubicin (DXR, below) to Tyrode solution. P wave was chosen as common origin of the curves. Note that DXR induces a slowing in contraction phase and increases in ECG intervals (PQ and SαT). |


