Uckermann O, Galli R, Mackenroth L, Geiger K, Steiner G, Koch E, Schackert G, Kirsch M Optical Biochemical Imaging: Potential New Applications in Neuro-Oncology European Association of NeuroOncology Magazine 2014; 4 (1): 20-26 PDF Summary Overview
| ||||||||||
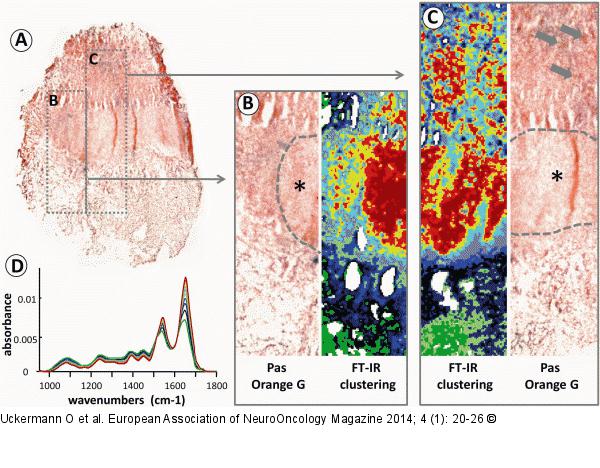
Figure/Graphic 2A-D: FT-IR imaging FT-IR imaging of human pituitary adenoma. (a) Overview of a cryosection of human pituitary adenoma stained using Pas-Orange-G and illustrating the production of human growth hormone (HGH). (b, c) High magnification of the areas indicated in (a) and corresponding FT-IR spectroscopic images obtained by cluster analysis. Large areas with increased HGH production are indicated by asterisks, local spots of hormone production are marked by arrows. (d) Representative spectra corresponding to area (b). |

Figure/Graphic 2A-D: FT-IR imaging
FT-IR imaging of human pituitary adenoma. (a) Overview of a cryosection of human pituitary adenoma stained using Pas-Orange-G and illustrating the production of human growth hormone (HGH). (b, c) High magnification of the areas indicated in (a) and corresponding FT-IR spectroscopic images obtained by cluster analysis. Large areas with increased HGH production are indicated by asterisks, local spots of hormone production are marked by arrows. (d) Representative spectra corresponding to area (b). |


