Uckermann O, Galli R, Mackenroth L, Geiger K, Steiner G, Koch E, Schackert G, Kirsch M Optical Biochemical Imaging: Potential New Applications in Neuro-Oncology European Association of NeuroOncology Magazine 2014; 4 (1): 20-26 PDF Summary Overview
| ||||||||||
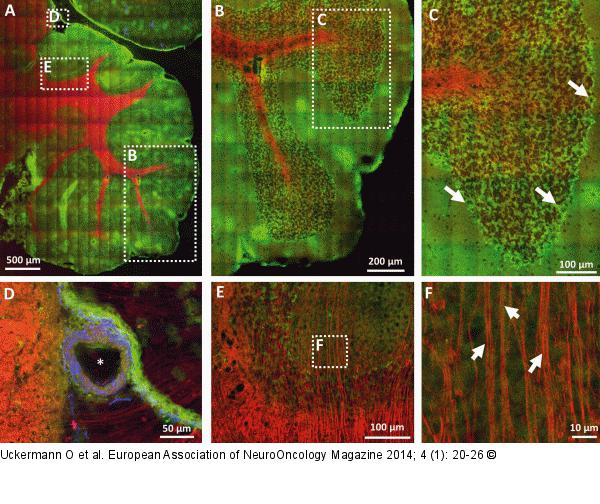
Figure/Graphic 4a-f: Multimodal NLO Multimodal NLO imaging of a mouse cerebellum (red: CARS, green: TPEF, blue: SHG). (a) Overview of the mouse cerebellum. (b) Magnification of the area indicated in (a). (c) Magnification of the area indicated in (b). Arrows indicate Purkinje cells characterized by punctuate fluorescence in the somata. (d) Magnification of the area indicated in (a), a large blood vessel is shown (*). (e) Magnification of the area indicated in (a), nerve fibres are indicated by intense CARS signal. (f) Magnification of the area indicated in (e). Single axons can be discerned (arrows). |

Figure/Graphic 4a-f: Multimodal NLO
Multimodal NLO imaging of a mouse cerebellum (red: CARS, green: TPEF, blue: SHG). (a) Overview of the mouse cerebellum. (b) Magnification of the area indicated in (a). (c) Magnification of the area indicated in (b). Arrows indicate Purkinje cells characterized by punctuate fluorescence in the somata. (d) Magnification of the area indicated in (a), a large blood vessel is shown (*). (e) Magnification of the area indicated in (a), nerve fibres are indicated by intense CARS signal. (f) Magnification of the area indicated in (e). Single axons can be discerned (arrows). |


