Uckermann O, Galli R, Mackenroth L, Geiger K, Steiner G, Koch E, Schackert G, Kirsch M Optical Biochemical Imaging: Potential New Applications in Neuro-Oncology European Association of NeuroOncology Magazine 2014; 4 (1): 20-26 PDF Summary Overview
| ||||||||||
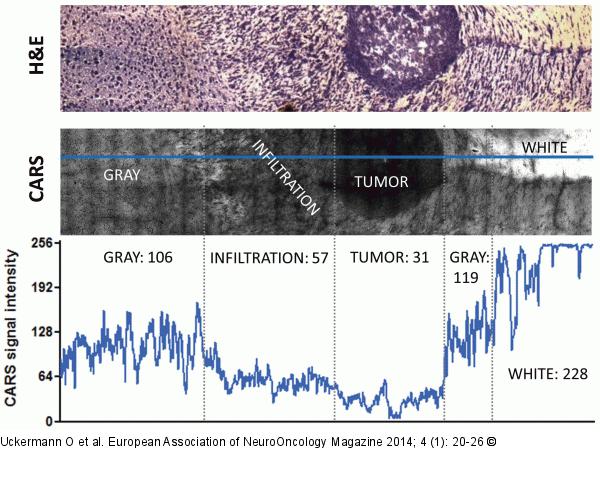
Figure/Graphic 3: CARS image CARS microscopy of infiltrative experimental glioblastoma in a mouse model: The intensity of the CARS image and the morphological details permit to distinguish between the tumour mass, the infiltrative area, and the normal brain grey and white matters. H&E staining (top) CARS image (centre). The intensity of the CARS signal along the blue line is plotted in the graph (bottom). Mean intensity values for the different types of tissue are also reported. Mean intensity that characterizes the normal grey tissue is reduced to approximately 50 % in the infiltrative area and to approximately 30 % in the tumour. Lipid rich white matter is characterized by high CARS signal intensity (228, saturation in some areas). |

Figure/Graphic 3: CARS image
CARS microscopy of infiltrative experimental glioblastoma in a mouse model: The intensity of the CARS image and the morphological details permit to distinguish between the tumour mass, the infiltrative area, and the normal brain grey and white matters. H&E staining (top) CARS image (centre). The intensity of the CARS signal along the blue line is plotted in the graph (bottom). Mean intensity values for the different types of tissue are also reported. Mean intensity that characterizes the normal grey tissue is reduced to approximately 50 % in the infiltrative area and to approximately 30 % in the tumour. Lipid rich white matter is characterized by high CARS signal intensity (228, saturation in some areas). |


