|
|
|---|
1. Gasser R;
Pätzold S;
Holzwart E;
Ablasser K;
Kraigher-Krainer E;
Friehs I;
Lewinski D;
Pieske B;
Mächler H;
Trantiner-Yates A;
Tscheliessnig KH;
Mangge H;
Porta S;
Gasser S
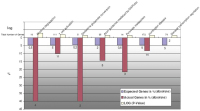
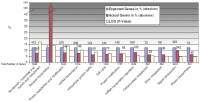
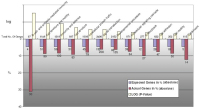
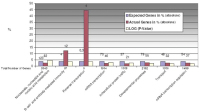
Immunological Implications in Experimental Myocardial Ischaemia: MPO (Myeloperoxidase) Expression Is Differentially Regulated by Beta-Blockers, While CD80 Expression Remains Unaffected
CD80 Experiments
Journal of Clinical and Basic Cardiology 2011; 14 (1-4): 16-22
It shows the results from real-time PCR measurements of
all CD80 experiments (o2ko: well-oxygenated, no ischaemia, no
drug; n2ko: experimental ischaemia, no drug; o2at: well-oxygenated,
no ischaemia, atenolol present; n2at: experimental ischaemia,
atenolol present; o2neb: well-oxygenated, nebivolol present; n2neb:
experimental ischaemia, nebivolol present). It can be seen that during
experimental ischaemia, there is an up-regulation of CD80 expression.
There is also a regulation with and without the influence of
beta-blockers during myocardial ischaemia. Keywords: CD80,
flowchart
|
|
|
2. Gasser R;
Pätzold S;
Holzwart E;
Ablasser K;
Kraigher-Krainer E;
Friehs I;
Lewinski D;
Pieske B;
Mächler H;
Trantiner-Yates A;
Tscheliessnig KH;
Mangge H;
Porta S;
Gasser S
Immunological Implications in Experimental Myocardial Ischaemia: MPO (Myeloperoxidase) Expression Is Differentially Regulated by Beta-Blockers, While CD80 Expression Remains Unaffected
Interleukin Pathway
Journal of Clinical and Basic Cardiology 2011; 14 (1-4): 16-22
Interleukin pathway up-regulated by nebivolol, not by
atenolol, during experimental ischaemia. Keywords: flowchart,
interleukin
|
|
|
3. Gasser R;
Pätzold S;
Holzwart E;
Ablasser K;
Kraigher-Krainer E;
Friehs I;
Lewinski D;
Pieske B;
Mächler H;
Trantiner-Yates A;
Tscheliessnig KH;
Mangge H;
Porta S;
Gasser S
Immunological Implications in Experimental Myocardial Ischaemia: MPO (Myeloperoxidase) Expression Is Differentially Regulated by Beta-Blockers, While CD80 Expression Remains Unaffected
MPO Experiments
Journal of Clinical and Basic Cardiology 2011; 14 (1-4): 16-22
It shows the results from real-time PCR measurements of
all MPO experiments (o2ko: well-oxygenated, no ischaemia, no
drug; n2ko: experimental ischaemia, no drug; o2at: well-oxygenated,
no ischaemia, atenolol present; n2at: experimental ischaemia,
atenolol present; o2neb: well-oxygenated, nebivolol present; n2neb:
experimental ischaemia, nebivolol present). Using PCR for validation,
we find that during experimental ischaemia, there is an up-regulation
of MPO expression. There is a differential regulation between
different beta-blockers during myocardial ischaemia, which warrants
further investigation. Keywords: flowchart,
MPO
|
|
|
4. Gasser R;
Roessl U;
Holzwart E;
Ablasser K;
Friehs I;
Lewinski D;
Pieske B;
Mächler H;
Trantiner-Yates A;
Tscheliessnig KH;
Mangge H;
Gasser S
Shift from Adult to Fetal Metabolic Phenotype During Prolonged Experimental Myocardial Ischemia: A Study on the Effect of Beta Blockers upon Gene Expression of Transmembrane Glucose Transporters
Myocardial Metabolism
Journal of Clinical and Basic Cardiology 2009; 12 (1-4): 11-17
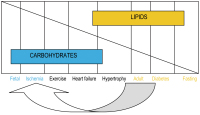
Plasticity of myocardial metabolism: during exercise, hypoxia/
ischemia etc myocardial cells prefer glucose as a substrate. Both
fasting and diabetes shift the metabolic substrates to the fatty acid
site. Mod. from [29, 33]. Keywords: chart,
Diagramm
|
|
|
5. Gasser R;
Roessl U;
Holzwart E;
Ablasser K;
Friehs I;
Lewinski D;
Pieske B;
Mächler H;
Trantiner-Yates A;
Tscheliessnig KH;
Mangge H;
Gasser S
Shift from Adult to Fetal Metabolic Phenotype During Prolonged Experimental Myocardial Ischemia: A Study on the Effect of Beta Blockers upon Gene Expression of Transmembrane Glucose Transporters
Cardiac metabolism
Journal of Clinical and Basic Cardiology 2009; 12 (1-4): 11-17
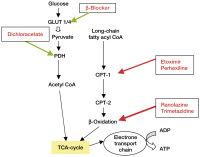
Shifting cardiac metabolism to its fetal phenotype: as an
anti-anginal target (mod. from [32]) of dichloracetate augments cellular
glucose metabolism. Etoximir and perhexiline inhibit cellular
fatty acid metabolism and both ranolazine as well as trimetazidine
slow down beta oxidation. Beta-adrenergic blockade enhances
GLUT1 and GLUT4 expressions. Keywords: Schema,
scheme
|
|
|
6. Gasser R;
Roessl U;
Holzwart E;
Ablasser K;
Friehs I;
Lewinski D;
Pieske B;
Mächler H;
Trantiner-Yates A;
Tscheliessnig KH;
Mangge H;
Gasser S
Shift from Adult to Fetal Metabolic Phenotype During Prolonged Experimental Myocardial Ischemia: A Study on the Effect of Beta Blockers upon Gene Expression of Transmembrane Glucose Transporters
Glucose metabolism
Journal of Clinical and Basic Cardiology 2009; 12 (1-4): 11-17
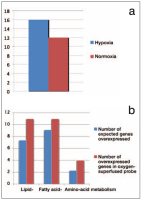
(a) Gene expression of biological processes associated
with glucose metabolism during normoxia and hypoxia. Up-regulation of glucose metabolism. (b) Down-regulation of gene expression of biological processes associated with fatty acid and amino acid
metabolism – (a) and (b) indicate a conversion to the fetal type of metabolism. Based on data from [4–9, 32–35]. Keywords: chart,
Diagramm
|
|
|
7. Gasser R;
Roessl U;
Holzwart E;
Ablasser K;
Friehs I;
Lewinski D;
Pieske B;
Mächler H;
Trantiner-Yates A;
Tscheliessnig KH;
Mangge H;
Gasser S
Shift from Adult to Fetal Metabolic Phenotype During Prolonged Experimental Myocardial Ischemia: A Study on the Effect of Beta Blockers upon Gene Expression of Transmembrane Glucose Transporters
Myocardial Metabolism
Journal of Clinical and Basic Cardiology 2009; 12 (1-4): 11-17
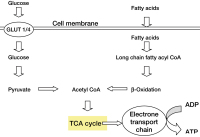
Substrates of myocardial metabolism. Mod. from [29, 32]. The fetal myocardial phenotype uses predominantly glucose for its
metabolism, whereas the adult individual mainly metabolises fatty
acids. During special conditions, like hypoxia, the adult phenotype of
myocardial metabolism converts to the fetal phenotype, again preferably
using glucose for its metabolism (Fig. 4). It has been shown
that a preferentially glucose-oriented cardiac metabolism is beneficial
in myocardial ischemia. However, knockout experiments have
shown that successful transfer to the fetal metabolism is possible
only under adequate/increased GLUT1 expression [33–35]. Keywords: chart,
Diagramm
|
|
|
8. Gasser R;
Roessl U;
Holzwart E;
Ablasser K;
Friehs I;
Lewinski D;
Pieske B;
Mächler H;
Trantiner-Yates A;
Tscheliessnig KH;
Mangge H;
Gasser S
Shift from Adult to Fetal Metabolic Phenotype During Prolonged Experimental Myocardial Ischemia: A Study on the Effect of Beta Blockers upon Gene Expression of Transmembrane Glucose Transporters
Real-time PCR
Journal of Clinical and Basic Cardiology 2009; 12 (1-4): 11-17
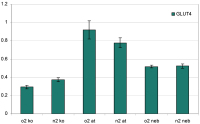
Results from real-time PCR measurements of all GLUT4
experiments (o2ko = well-oxygenated, no ischemia, no drug; n2ko =
experimental ischemia, no drug; o2at = well-oxygenated, no ischemia,
atenolol present; n2at = experimental ischemia, atenolol present;
o2neb = well-oxygenated, nebivolol present; n2neb = experimental
ischemia, nebivolol present). It can be seen that during experimental
ischemia, there is an up-regulation of GLUT4 (SLC2A4) expression,
however not statistically significant. Keywords: chart,
Diagramm
|
|
|
9. Gasser R;
Roessl U;
Holzwart E;
Ablasser K;
Friehs I;
Lewinski D;
Pieske B;
Mächler H;
Trantiner-Yates A;
Tscheliessnig KH;
Mangge H;
Gasser S
Shift from Adult to Fetal Metabolic Phenotype During Prolonged Experimental Myocardial Ischemia: A Study on the Effect of Beta Blockers upon Gene Expression of Transmembrane Glucose Transporters
Real-time PCR
Journal of Clinical and Basic Cardiology 2009; 12 (1-4): 11-17
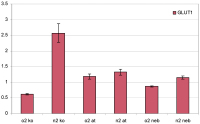
Results from real-time PCR measurements of 72 experiments (n = 12 in each group; o2ko = well-oxygenated, no ischemia,
no drug; n2ko = experimental ischemia, no drug; o2at = well-oxygenated,
no ischemia, atenolol present; n2at = experimental ischemia,
atenolol present; o2neb = well-oxygenated, nebivolol present;
n2neb = experimental ischemia, nebivolol present). It can be seen
that during experimental ischemia, there is an up-regulation of
GLUT1 expression, however, not statistically significant. This confirms
earlier data by our group. While there is no significant regulation
with and without the influence of beta blockers during myocardial
ischemia either, there is, however, a significant difference between
the expression of GLUT1 in well-oxygenized preparations with
(0.87 ± 0.02) and without nebivolol (0.62 ± 0.02; ± SEM; p ≤ 0.05).
Similarly, atenolol led to an increase of GLUT1 expression in welloxygenated
preparations compared to controls: 1.18 ± 0.08 and
0.62 ± 0.02, respectively (+ SEM; p < 0.05) Keywords: chart,
Diagramm
|
|
|
10. Gasser R;
Ablasser K;
Roessl U;
Kraigher-Krainer E;
Lewinski D;
Mangge H;
Mächler H;
Trantina-Yates A;
Tscheliessnigg KH;
Udermann H;
Porta S;
Friehs I;
Scherr E;
Brussee H;
Gasser S
Differential Gene Expression und Nebivolol and Atenolol during Experimental Ischemia in Human Myocardium
Nebivolol - Biological Pathway
Journal of Clinical and Basic Cardiology 2008; 11 (1-4): 16-23
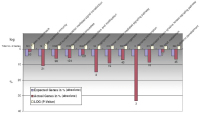
Concerning nebivolol-regulated biological pathways, we could see that, during normoxia, up-regulation of pathways is hardly pronounced by nebivolol over atenolol. This becomes evident also in Figure 9a, only 3
pathways are affected here. Noteworthy here, too, the interleukin signalling pathway. Keywords: Atenolol,
flowchart,
Nebivolol
|
|
|
11. Gasser R;
Ablasser K;
Roessl U;
Kraigher-Krainer E;
Lewinski D;
Mangge H;
Mächler H;
Trantina-Yates A;
Tscheliessnigg KH;
Udermann H;
Porta S;
Friehs I;
Scherr E;
Brussee H;
Gasser S
Differential Gene Expression und Nebivolol and Atenolol during Experimental Ischemia in Human Myocardium
Pathway - Up-Regulation
Journal of Clinical and Basic Cardiology 2008; 11 (1-4): 16-23
Generally, we could see that, during experimental ischemia, upregulation of pathways is minimal by nebivolol over atenolol. This becomes
evident in Figure 9a, only 3 pathways are affected. However, the interleukin signalling pathway may be of interest in connection with inflammation, scarring
and remodelling. Keywords: Atenolol,
flowchart,
ischaemia,
Nebivolol
|
|
|
12. Gasser R;
Ablasser K;
Roessl U;
Kraigher-Krainer E;
Lewinski D;
Mangge H;
Mächler H;
Trantina-Yates A;
Tscheliessnigg KH;
Udermann H;
Porta S;
Friehs I;
Scherr E;
Brussee H;
Gasser S
Differential Gene Expression und Nebivolol and Atenolol during Experimental Ischemia in Human Myocardium
Biological Pathways
Journal of Clinical and Basic Cardiology 2008; 11 (1-4): 16-23
In well-oxygenized preparations, we can see that numerous biological pathways, mainly those involved in signalling, angiogenesis, cellular immunity, and EGF are affected by nebivolol but not by atenolol. Keywords: Atenolol,
biological pathway,
flowchart,
Nebivolol
|
|
|
13. Gasser R;
Ablasser K;
Roessl U;
Kraigher-Krainer E;
Lewinski D;
Mangge H;
Mächler H;
Trantina-Yates A;
Tscheliessnigg KH;
Udermann H;
Porta S;
Friehs I;
Scherr E;
Brussee H;
Gasser S
Differential Gene Expression und Nebivolol and Atenolol during Experimental Ischemia in Human Myocardium
Gene expression
Journal of Clinical and Basic Cardiology 2008; 11 (1-4): 16-23
It is interesting that nebivolol but not atenolol leads to a downregulation of gene expression in glutamine-glutamate conversion and pyruvate
metabolism, the latter of particular interest in ischemia. Keywords: Atenolol,
flowchart,
gene expression,
Nebivolol
|
|
|
14. Gasser R;
Ablasser K;
Roessl U;
Kraigher-Krainer E;
Lewinski D;
Mangge H;
Mächler H;
Trantina-Yates A;
Tscheliessnigg KH;
Udermann H;
Porta S;
Friehs I;
Scherr E;
Brussee H;
Gasser S
Differential Gene Expression und Nebivolol and Atenolol during Experimental Ischemia in Human Myocardium
Well-oxygenized preparations
Journal of Clinical and Basic Cardiology 2008; 11 (1-4): 16-23
In well-oxygenized preparations, we can see that numerous biochemical processes are up-regulated by nebivolol (not by atenolol). Interesting are reverse transcription, stress response, and protein phosphorylation. Keywords: biochemical process,
flowchart
|
|
|
15. Gasser R;
Ablasser K;
Roessl U;
Kraigher-Krainer E;
Lewinski D;
Mangge H;
Mächler H;
Trantina-Yates A;
Tscheliessnigg KH;
Udermann H;
Porta S;
Friehs I;
Scherr E;
Brussee H;
Gasser S
Differential Gene Expression und Nebivolol and Atenolol during Experimental Ischemia in Human Myocardium
Biochemical process
Journal of Clinical and Basic Cardiology 2008; 11 (1-4): 16-23
In well-oxygenized preparations, we can see that numerous biochemical processes, mainly those involved in signalling and cellular immunity, are affected by nebivolol but not by atenolol. In the lower part, we can see that many processes involved in contraction, lipid metabolism, and proliferation are down-regulated by nebivolol only (not by atenolol). This kind of
processes, if slowed down, may render the heart less vulnerable to O2 deficit or ischemia. Keywords: biochemical process,
flowchart
|
|
|
16. Gasser R;
Ablasser K;
Roessl U;
Kraigher-Krainer E;
Lewinski D;
Mangge H;
Mächler H;
Trantina-Yates A;
Tscheliessnigg KH;
Udermann H;
Porta S;
Friehs I;
Scherr E;
Brussee H;
Gasser S
Differential Gene Expression und Nebivolol and Atenolol during Experimental Ischemia in Human Myocardium
Nebivolol - Atenolol
Journal of Clinical and Basic Cardiology 2008; 11 (1-4): 16-23
Similarly, as in Figure 4, biological processes involved in cell-mediated immunity and reverse transcription are significantly up-regulated by nebivolol and not by atenolol. One may deduce that both cellular immunity
as well as reverse transcription are regulated by nebivolol at various sites. Keywords: Atenolol,
flowchart,
Nebivolol
|
|
|
17. Gasser R;
Ablasser K;
Roessl U;
Kraigher-Krainer E;
Lewinski D;
Mangge H;
Mächler H;
Trantina-Yates A;
Tscheliessnigg KH;
Udermann H;
Porta S;
Friehs I;
Scherr E;
Brussee H;
Gasser S
Differential Gene Expression und Nebivolol and Atenolol during Experimental Ischemia in Human Myocardium
Nebivolol - Atenolol
Journal of Clinical and Basic Cardiology 2008; 11 (1-4): 16-23
This figure shows biological processes more than twofold downregulated in the presence of nebivolol but unaffected by atenolol during simulated ischemia (100 % O2 replaced by 100 % N2 perfusion). One can
see that, in particular on the level of reverse transcription and T-cell-mediated immunity as well as in the process of angiogenesis, a noteworthy regulation
is brought about by nebivolol. Keywords: Atenolol,
flowchart,
Nebivolol
|
|
|
18. Gasser R;
Ablasser K;
Roessl U;
Kraigher-Krainer E;
Lewinski D;
Mangge H;
Mächler H;
Trantina-Yates A;
Tscheliessnigg KH;
Udermann H;
Porta S;
Friehs I;
Scherr E;
Brussee H;
Gasser S
Differential Gene Expression und Nebivolol and Atenolol during Experimental Ischemia in Human Myocardium
Hypoxia
Journal of Clinical and Basic Cardiology 2008; 11 (1-4): 16-23
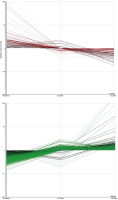
Panels A und B show all genes regulated significantly during experimental myocardial ischemia (hypoxia) in the presence and absence of either atenolol or nebivolol. Panel A (red) summarizes all
genes down-regulated by nebivolol compared to those up-regulated by atenolol during hypoxia. N2 control indicates gene expression in ischemic preparations without betablockers. N2 nebivolol indicates gene expression in the presence of nebivolol in ischemic preparations.
The red and green lines indicate the direction of gene regulation. On the left side of panel A, N2 atenolol represents genes upregulated under atenolol during hypoxia. Panel B, accordingly, shows all genes up-regulated by nebivolol which are down-regulated
by atenolol (N2 control here also representing non-treated controls). Keywords: Atenolol,
hypoxia,
Nebivolol
|
|
|
19. Gasser R;
Ablasser K;
Roessl U;
Kraigher-Krainer E;
Lewinski D;
Mangge H;
Mächler H;
Trantina-Yates A;
Tscheliessnigg KH;
Udermann H;
Porta S;
Friehs I;
Scherr E;
Brussee H;
Gasser S
Differential Gene Expression und Nebivolol and Atenolol during Experimental Ischemia in Human Myocardium
Atenolol - Nebivolol
Journal of Clinical and Basic Cardiology 2008; 11 (1-4): 16-23
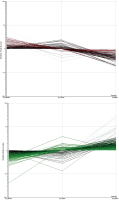
Panels A und B show all genes regulated by either atenolol or nebivolol under non-ischemic, well-oxygenated conditions. Panel
A (red) summarizes all genes down-regulated by nebivolol compared to those up-regulated by atenolol during normoxia. Hence, panel A demonstrates the direct influence of atenolol and nebivolol
on gene expression in well-oxygenated preparations. It can easily be seen that, under optimal conditions, without any sign of ischemia/hypoxia, the effect of nebivolol upon gene expression is quite different
from that of atenolol. O2 control indicates gene expression in well-oxygenated preparations without betablockers. O2 nebivolol indicates gene expression in the presence of nebivolol in non-ischemic,
well-oxygenated preparations. The red and green lines indicate the direction of gene regulation. On the left side of panel A, O2 atenolol represents genes differentially expressed under atenolol during control
conditions. Panel B, accordingly, shows all genes up-regulated by nebivolol which are down-regulated by atenolol (O2 control here also representing untreated controls). Keywords: Atenolol,
Nebivolol
|
|
|
20. Gasser R;
Ablasser K;
Roessl U;
Kraigher-Krainer E;
Lewinski D;
Mangge H;
Mächler H;
Trantina-Yates A;
Tscheliessnigg KH;
Udermann H;
Porta S;
Friehs I;
Scherr E;
Brussee H;
Gasser S
Differential Gene Expression und Nebivolol and Atenolol during Experimental Ischemia in Human Myocardium
Micriarray experiments
Journal of Clinical and Basic Cardiology 2008; 11 (1-4): 16-23
Typical results derived from microarray experiments. Light intensities on the microtiter plate reflect gene expression. Keywords: light intensities
|
|
|
21. Gasser R;
Gasser S;
Ablasser K;
Scherr E;
Roessl U;
Lewinski D;
Mangge H;
Dellacher A;
Mächler H;
Trantina-Yates A;
Tscheliessnigg KH
Quantification of GLUT4 Gene Expression in Human Atrial Myocardium of Hypertensive Patients and the Effect of Experimental Ischaemia Thereupon
Expression of GLUT4
Journal of Clinical and Basic Cardiology 2007; 10 (1-4): 1-6
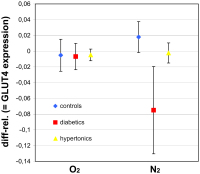
Relative difference in the expression of GLUT4 under ischaemic and non-ischaemic conditions (n = 8; ± SEM) in hypertensive, diabetic and control subjects. Results show slight trends in GLUT4 mRNA expression, however no statistical significance could be seen in either group. Keywords: Diagramm,
flowchart,
GLUT4,
ischaemia,
Ischämie
|
|
|
22. Gasser R;
Gasser S;
Ablasser K;
Scherr E;
Roessl U;
Lewinski D;
Mangge H;
Dellacher A;
Mächler H;
Trantina-Yates A;
Tscheliessnigg KH
Quantification of GLUT4 Gene Expression in Human Atrial Myocardium of Hypertensive Patients and the Effect of Experimental Ischaemia Thereupon
Hypertensive Patients
Journal of Clinical and Basic Cardiology 2007; 10 (1-4): 1-6
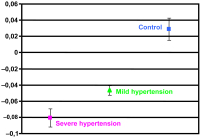
Mean ± SEM of the relative myocardial cellular GLUT4 gene expression in the three tested groups displays clearly the lower GLUT4 expression in hypertensive patients directly snap-frozen during cardiac surgery, not equilibrated with 100 % O2. Keywords: Diagramm,
flowchart,
GLUT4,
hypertension,
Hypertonie
|
|
|
23. Gasser R;
Gasser S;
Ablasser K;
Scherr E;
Roessl U;
Lewinski D;
Mangge H;
Dellacher A;
Mächler H;
Trantina-Yates A;
Tscheliessnigg KH
Quantification of GLUT4 Gene Expression in Human Atrial Myocardium of Hypertensive Patients and the Effect of Experimental Ischaemia Thereupon
GLUT4
Journal of Clinical and Basic Cardiology 2007; 10 (1-4): 1-6
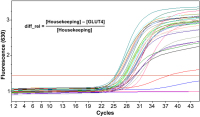
The amount of cycles needed for the amplification curve to exceed the background fluorescence (dashed line) represents the CT value. The quantity of myocardial cellular GLUT4 gene expression is shown as relative difference, which is calculated from the CT values of the housekeeping and the GLUT4 PCR. Keywords: amplification curve,
Amplifikationskurve,
GLUT4
|
|
|
| |

 Suche Medizinische Publikationen
 Suche Abbildungen und Grafiken
 Medizinprodukte - Labortechnik
 Antidotarium (Stand 2012)
 Phytokodex (Stand 2012)
 Fachbücher
 Patientenliteratur