| |
| Alle Journale wurden nach durchsucht |
Treffer 11841 - 11880 von 11970 |
|
|
|---|
11841. Kuleshova EV;
Abezgauz IA;
Antonova IS;
Bieberstein D;
Borisenko LV;
Gusarov GV;
Kantsevitch IA;
Kraul H;
Lokhovinina NL;
Perepech NB;
Tsay NV
Efficacy of slow-release Nifedipine, Talinolol and combination in Angina Pectoris (NITAAP)
NITAAP-Studie
Journal of Clinical and Basic Cardiology 2000; 3 (1): 29-34
The drug application process Keywords: Angina pectoris,
Angina pectoris,
Nifedipin,
nifedipine,
NITAAP,
NITAAP,
Schema,
Studie,
study,
talinolol,
talinolol
|
|
|
11842. Brunelli C;
Bezante GP;
Merello MR;
Pasdera A;
Rossettin P;
Spallarossa P;
Zorzet F
Cost analysis of acute myocardial infarction management in DRG and PRG
Akuter Myokardinfarkt - Management
Journal of Clinical and Basic Cardiology 2000; 3 (1): 23-28
Comparison between real costs and government-established reimbursement rate for eacht DRG considered Keywords: acute myocardial infarction,
akuter Myokardinfarkt,
cost analysis,
Diagramm,
economy,
Kostenanalyse,
Ökonomie
|
|
|
|
|
|
|
|
|
|
|
|
11846. Staessen JA;
Celis H;
Fagard RH;
Gasowski J;
Thijs L;
Wang JG
Use of dihydropyridines for antihypertensive treatment in older patients: evidence from the Systolic Hypertension in Europe trial
Hypertonie - Demenz
Journal of Clinical and Basic Cardiology 2000; 3 (1): 15-21
Incidence of dementia by treatment group in the intention-to-treat and per-protocol analyses Keywords: antihypertensives,
Antihypertensivum,
dementia,
Demenz,
Diagramm,
hypertension,
Hypertonie,
Studie,
study,
Systolic Hypertension in Europe Trial,
Systolic Hypertension in Europe Trial
|
|
|
11847. Birkhäuser M
Editorial
HR - O2P
Journal für Menopause 2000; 7 (Sonderheft 1) (Ausgabe für Schweiz):
Comparison of peak HR and peak O2P between the vasodilator group (A) and the beta blocker group (B). Keywords: flowchart,
HR,
Menopause,
O2P
|
|
|
11848. Latific-Jasnic D;
Gabrijelcic T;
Rakovec P;
Ruzic-Medvescek N;
Zorman D
Aborted sudden death during sports activity due to anomalous origin of the left coronary artery from the pulmonary trunk - dilemmas concerning surgical repair of the anomaly
Koronare Anomalie
Journal of Clinical and Basic Cardiology 1999; 2 (2): 279-280
Angiogram of the left coronary artery after the first operation. The left main coronary artery is twisted and substantially narrowed. Keywords: Angiographie,
angiography,
Arteria coronaria sinistra,
Arteria coronaria sinistra
|
|
|
11849. Cugini P;
Bernardini F;
Cammarota C;
Cedrone L;
Curione M;
Danese C;
Proietti E
Evidence that the information entropy estimating the nonlinear variability of human sinusial R-R intervals shows a circadian rhythm
Zirkadianer Rhythmus
Journal of Clinical and Basic Cardiology 1999; 2 (2): 275-278
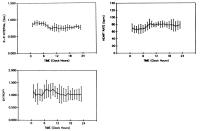
Mean cosinograms provided by the three-component harmonic method applied to the hourly-qualified values of the sinusal R-R interval, heart rate and information entropy measurement in clinically healthy subjects Keywords: blood pressure,
Blutdruck,
cosinogram,
Cosinogramm,
Diagramm,
Entropie,
entropy,
heart rate,
Herzfrequenz
|
|
|
11850. Cugini P;
Bernardini F;
Cammarota C;
Cedrone L;
Curione M;
Danese C;
Proietti E
Evidence that the information entropy estimating the nonlinear variability of human sinusial R-R intervals shows a circadian rhythm
Zirkadianer Rhythmus
Journal of Clinical and Basic Cardiology 1999; 2 (2): 275-278
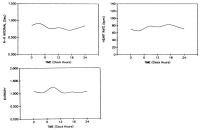
Mean chronograms provided by conventional parametric biometry applied to the hourly-qualified values of the sinusal R-R interval, heart rate and information entropy measurement in clinically healthy subjects Keywords: blood pressure,
Blutdruck,
chronogram,
Chronogramm,
Diagramm,
Entropie,
entropy,
heart rate,
Herzfrequenz
|
|
|
11851. Wicher C;
Biewald G-A
Left-ventricular dysfunction, heart vagus influences and angiotensin II effects after doxorubicin perfusion in isolated rat hearts
Doxorubicin - Angiotensin-II-Modulation
Journal of Clinical and Basic Cardiology 1999; 2 (2): 259-266
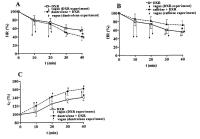
Heart rate (HR, A, B) and time constant of contraction τC (C) during perfusion (for 40 min) of isolated rat hearts with doxorubicin (DXR, 20 micromol/L)-containing Tyrode solution, and after addition of dantrolene (10 micromol/L, A, C) and caffeine (10 mmol/L, B) to DXR-containing Tyrode solution, respectively. Values were normalized on HR or τC of control recording (during Tyrode erfusion). Drugs were applied at the time point "0 min". Means and SD of 5 experiments with DXR perfusion (solid line and open squares in A-C) and of 5 experiments each where a perfusion with dantrolene (A,C) or caffeine (B) + DXR was performed (dashed lines and filled circles). Vagus stimulation (right N. vagus, 10 Hz, 10 V, 10 s stimulation period) effects were recorded in intervals of 10 min starting after drugs administration (the arrows represent HR reductions / τC increases caused each by vagus stimulation. Full line arrows, vagus stimulation effects during DXR perfusion; dashed line arrows, vagus stimulation effects during perfusion with dantrolene/caffeine+DXR containing solution). Note that HR was significantly (P < 0.05, asterisks) reduced (A) / increased (B) after 40 min perfusion with dantrolene+DXR / caffeine+DXR, compared with HR in DXR perfusion experiments. τC was significant increased after 40 min perfusion with dantrolene+DXR, compared with HR in DXR perfusion experiments. Caffeine reduces, dantrolene increases the observed DXR actions regarding HR, τC and vagus stimulation effects. Keywords: Angiotensin II,
Angiotensin II,
Dantrolen,
dantrolene,
Diagramm,
doxorubicin,
doxorubicin,
heart rate,
Herzfrequenz,
Nervus vagus,
Nervus vagus
|
|
|
11852. Wicher C;
Biewald G-A
Left-ventricular dysfunction, heart vagus influences and angiotensin II effects after doxorubicin perfusion in isolated rat hearts
Doxorubicin - Angiotensin-II-Modulation
Journal of Clinical and Basic Cardiology 1999; 2 (2): 259-266
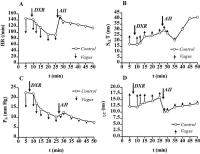
Time courses of heart rate (HR, A), SαT time (B), systolic pressure PS (C) and time constant of contraction τC (D) and changes in above parameters during vagus stimulation (right N. vagus, 10 Hz, 10 V), recorded in an isolated rat heart (modified Langendorff preparation) before and during doxorubicin (DXR) perfusion (20 micromol/L) and after addition of angiotensin II (AII, 1 micro mol/L). AII was added 20 min after DXR application to Tyrode solution. Small vertical arrows which originate from the curves, show changes in the parameters mentioned above, caused by vagus stimulation. Note, that vagus effects were progressively reduced during DXR perfusion. Addition of AII caused positive chronotropic and inotropic effects for a short time. Additionally, AII addition reduced vagus stimulation effects regarding above parameters (especially HR and PS). At the end of experiment, all vagus effects
were nearly completely disappeared. Keywords: Angiotensin II,
Angiotensin II,
Diagramm,
doxorubicin,
doxorubicin,
heart rate,
Herzfrequenz,
Nervus vagus,
Nervus vagus,
systolic blood pressure,
systolischer Blutdruck
|
|
|
11853. Wicher C;
Biewald G-A
Left-ventricular dysfunction, heart vagus influences and angiotensin II effects after doxorubicin perfusion in isolated rat hearts
Doxorubicin - Angiotensin-II-Modulation
Journal of Clinical and Basic Cardiology 1999; 2 (2): 259-266
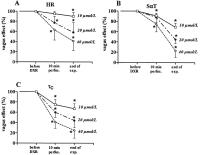
Dose-dependence of the changes in vagus stimulation (right N. vagus, 10 Hz, 10 V) effects
on heart rate (HR, A), SαT time (B) and time constant of contraction τC (C) during perfusion of isolated rat hearts with doxorubicin (DXR)-containing Tyrode. 10 micromol/L DXR: solid line and open squares, 20 micromol/L DXR: dash-dotted line and filled circles, 40 micromol/L DXR: dashed line and open rhombs. Vagus stimulation effects before DXR addition to Tyrode were set to 100 %. Vagus stimulation effects were recorded 10 min after start of DXR perfusion and shortly before the end of each experiment (duration of experiments was the shorter the higher the DXR doses: hearts beated about 60 min after addition of 10 micro mol/L DXR, 40 min after addition of 20 micro mol/L DXR and 25 min after addition of
40 micro mol/L DXR). Means and SD of 5 experiments. Asterisks, significant changes compared with control values before DXR perfusion (P < 0.05). Keywords: Angiotensin II,
Angiotensin II,
Diagramm,
doxorubicin,
doxorubicin,
heart rate,
Herzfrequenz,
Nervus vagus,
Nervus vagus
|
|
|
11854. Wicher C;
Biewald G-A
Left-ventricular dysfunction, heart vagus influences and angiotensin II effects after doxorubicin perfusion in isolated rat hearts
Doxorubicin - Angiotensin-II-Modulation
Journal of Clinical and Basic Cardiology 1999; 2 (2): 259-266
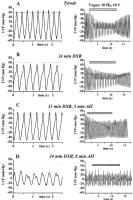
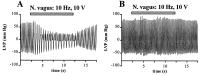
Time courses of left-ventricular pressure (LVP) in isolated rat heart before (left figures) and during vagus stimulation (10 Hz, 10 V, 10 s stimulation period, right figures), recorded during Tyrode perfusion, Tyrode + doxorubicin (DXR) perfusion and Tyrode + DXR + angiotensin II (AII) perfusion. 20 micromol/L DXR and 1 micormol/L AII were applied in this experiment. AII was added 26 minutes after DXR administation. A Tyrode perfusion, B after 24 min perfusion with Tyrode + DXR, C after 5 min perfusion with Tyrode + DXR + AII (31 min after DXR application) and D 3 minutes later than C (after 8 min perfusion with Tyrode + DXR + AII, 34 min after DXR application = end of the experiment). Horizontal bars (right figures) mark the time period of vagus stimulation. Keywords: Angiotensin II,
Angiotensin II,
Diagramm,
doxorubicin,
doxorubicin,
left ventricular pressure,
linksventrikulärer Druck
|
|
|
11855. Wicher C;
Biewald G-A
Left-ventricular dysfunction, heart vagus influences and angiotensin II effects after doxorubicin perfusion in isolated rat hearts
Doxorubicin - Angiotensin-II-Modulation
Journal of Clinical and Basic Cardiology 1999; 2 (2): 259-266
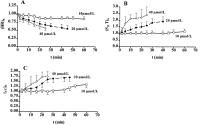
Normalized changes in heart rate (HR, A), SαT (B) time of the ECG and time constant of left-ventricular contraction τC (C) during perfusion of isolated heart with doxorubicin (DXR, 10-40
micromol/L)-containing Tyrode (parameters before DXR addition were set to 1). 10 micromol/L DXR: solid line and open squares, 20 micromol/L DXR: dash-dotted line and filled circles, 40 micromol/L DXR: dashed line and open rhombs. Means and SD of 5 experiments. Note that DXR perfusion caused reductions in heart rate by up to 50 %, and
increases in SαT by up to 150 %, and increase in τC by up to 75 % (after 25 minutes perfusion with 40 micromol/L DXR-containing Tyrode). Keywords: Angiotensin II,
Angiotensin II,
Diagramm,
doxorubicin,
doxorubicin,
heart rate,
Herzfrequenz
|
|
|
11856. Wicher C;
Biewald G-A
Left-ventricular dysfunction, heart vagus influences and angiotensin II effects after doxorubicin perfusion in isolated rat hearts
Doxorubicin - Angiotensin-II-Modulation
Journal of Clinical and Basic Cardiology 1999; 2 (2): 259-266
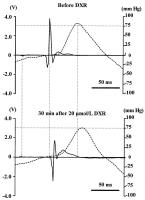
Superimposed single time courses of left-ventricular pressure (LVP, dashed line) and electrocardiogram (ECG, solid line), recorded in isolated rat hearts before (above) and 30 min after addition of 20 micromol/L doxorubicin (DXR, below) to Tyrode solution. P wave was chosen as common origin of the curves. Note that DXR induces a slowing in contraction phase and increases in ECG intervals (PQ and SαT). Keywords: Angiotensin II,
Angiotensin II,
Diagramm,
doxorubicin,
doxorubicin,
electrocardiography,
Elektrokardiographie,
left ventricular pressure,
linksventrikulärer Druck
|
|
|
11857. Wicher C;
Biewald G-A
Left-ventricular dysfunction, heart vagus influences and angiotensin II effects after doxorubicin perfusion in isolated rat hearts
Angiotensin II - Vagusstimulation
Journal of Clinical and Basic Cardiology 1999; 2 (2): 259-266
Effects of angiotensin II on time course of left-ventricular pressure (LVP) and on vagus stimulation effect, recorded in isolated rat hearts (modified Langendorff preparation). Time periods of vagus stimulation (right N. vagus, 10 Hz, 10 V, 10 s stimulation period) are marked by horizontal bars. A: control recording before AII application, B: recording 5 min after addition of 2 micromol/L AII to perfusion solution. Note clear reductions in heart rate and systolic pressure caused by vagus timulation during Tyrode perfusion (A). AII had direct positive chronotropic and inotropic effects and inhibited the vagus stimulation effects (B). Keywords: Angiotensin II,
Angiotensin II,
Diagramm,
left ventricular pressure,
linksventrikulärer Druck,
Nervus vagus,
Nervus vagus
|
|
|
11858. Gasser R;
Byon YK;
Fleckenstein A;
Fleckenstein-Grün G;
Frey G
Some observations on Ca-overload in rat ventricular tissue
Myokard - Kalzium
Journal of Clinical and Basic Cardiology 1999; 2 (2): 255-258
Resting tension increases more than twofold in papillary muscels of vit. D3-intoxicated rats. The administration of diltiazem or verapamil attenuates this increase in resting tension. Keywords: calcium,
Diagramm,
Diltiazem,
Diltiazem,
Kalzium,
myocardium,
Myokard,
Papillarmuskulatur,
papillary muscle,
resting tension,
Verapamil,
Verapamil,
Vitamin D,
Vitamin D
|
|
|
11859. Gasser R;
Byon YK;
Fleckenstein A;
Fleckenstein-Grün G;
Frey G
Some observations on Ca-overload in rat ventricular tissue
Myokard - Kalzium
Journal of Clinical and Basic Cardiology 1999; 2 (2): 255-258
Typical membrane potential (Vm), Ca++-electrode potential (VCaE) and differential potential (Vdiff) as well as resting tension in control conditions (left hand panel) and in vit. D3-intoxicated rats (right hand panel). Recordings from two individual experiments. Keywords: calcium,
Diagramm,
Kalzium,
membrane potential,
Membranpotential,
myocardium,
Myokard,
Vitamin D,
Vitamin D
|
|
|
11860. Gasser R;
Byon YK;
Fleckenstein A;
Fleckenstein-Grün G;
Frey G
Some observations on Ca-overload in rat ventricular tissue
Mykard - Kalzium
Journal of Clinical and Basic Cardiology 1999; 2 (2): 255-258
Myocardial (Ca++)i in rat papillary muscle at rest. In those rats which received high dose vit. D3, (Ca++)i was increased over 160 times. This rather dramatic rise in (Ca++)i could be largely prevented by s.c. administration of diltiazem and verapamil. Keywords: calcium,
Diagramm,
Diltiazem,
Diltiazem,
Kalzium,
microelectrodes,
Mikroelektrode,
myocardium,
Myokard,
Verapamil,
Verapamil
|
|
|
|
|
|
11862. Volozh O;
Abina J;
Deev A;
Goldsteine G;
Kalyuste T;
Kaup R;
Olferiev A;
Solodkaya E
Lipid disorders and their changes in postsocialist Estonia
Lipide - Estland
Journal of Clinical and Basic Cardiology 1999; 2 (2): 249-253
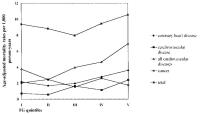
Age-adjusted mortality rates by quintiles of triglycerides in men aged 20 to 59; Tg – triglycerides Keywords: Diagramm,
Estland,
Estonia,
mortality,
Mortalität,
triglyceride,
Triglyzeride
|
|
|
11863. Volozh O;
Abina J;
Deev A;
Goldsteine G;
Kalyuste T;
Kaup R;
Olferiev A;
Solodkaya E
Lipid disorders and their changes in postsocialist Estonia
Lipide - Estland
Journal of Clinical and Basic Cardiology 1999; 2 (2): 249-253
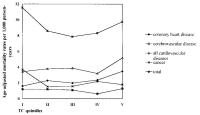
Age-adjusted mortality rates by quintiles of total cholesterol in men aged 20 to 59; TC – total cholesterol Keywords: Cholesterin,
Diagramm,
Estland,
Estonia,
Gesamtcholesterin,
mortality,
Mortalität,
total cholesterol
|
|
|
11864. Volozh O;
Abina J;
Deev A;
Goldsteine G;
Kalyuste T;
Kaup R;
Olferiev A;
Solodkaya E
Lipid disorders and their changes in postsocialist Estonia
Lipide - Estland
Journal of Clinical and Basic Cardiology 1999; 2 (2): 249-253
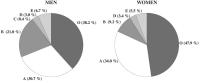
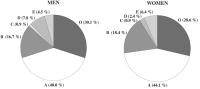
Distribution of the population of Tallinn aged 30 to 54 according to the EAS classification of hyperlipidaemia at the II survey. EAS – European Atherosclerosis Society Keywords: Diagramm,
Estland,
Estonia,
Frau,
hyperlipidaemia,
Hyperlipidämie,
Mann,
men,
women
|
|
|
11865. Volozh O;
Abina J;
Deev A;
Goldsteine G;
Kalyuste T;
Kaup R;
Olferiev A;
Solodkaya E
Lipid disorders and their changes in postsocialist Estonia
Lipide - Estland
Journal of Clinical and Basic Cardiology 1999; 2 (2): 249-253
Distribution of the population of Tallinn aged 30 to 54 according to the EAS classification of hyperlipidaemia at the I survey Keywords: Diagramm,
Estland,
Estonia,
Frau,
hyperlipidaemia,
Hyperlipidämie,
Mann,
men,
women
|
|
|
11866. Szili-Török T;
Gingl Z;
Halmai L;
Kardos A;
Rudas L
Windowed FFT - a time-variant spectral analysis: applicability during the head-up tilt test
Kipptisch
Journal of Clinical and Basic Cardiology 1999; 2 (2): 241-244
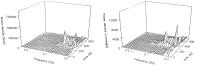
3D projection of the HRV (upper panel) and BPV (lower panel) spectral changes following the upright tilt as assessed by windowed FFT in the same syncopal patients as in Fig. 2. The spatial projection allows a thorough assessment of the temporal changes and interrelationship of all spectral components. Thus, it is apparent that the double elevation in the LFBPV response depicted in Fig. 2 is related to changes in different segments of the LF band. Even the two minor elevations in the HFBPV band are quite discernible. Keywords: blood pressure,
Blutdruck,
Diagramm,
heart rate,
Herzfrequenz,
Kipptisch,
tilt table
|
|
|
11867. Szili-Török T;
Gingl Z;
Halmai L;
Kardos A;
Rudas L
Windowed FFT - a time-variant spectral analysis: applicability during the head-up tilt test
Kipptisch
Journal of Clinical and Basic Cardiology 1999; 2 (2): 241-244
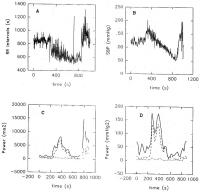
Typical tilt-induced responses of a tilt-positive patient. Panel A. The RR interval tachogram. The tilting, indicated by a vertical line is reflected by an immediate HR acceleration. The sudden-onset bradycardia after 800 s of the recording coincides with the syncopal episode. Panel B. The systolic BP trend curve reveals transient stabilisation post-tilting, followed by a marked hypotension, eventually leading syncope. Panels C and D. Variations in HR (C) and systolic BP (D) with time, as assessed by windowed FFT in the same arrangement as in Figure 1. The upright tilt manoeuvre is paralleled by elevations in the LFHRV and TFHRV powers. The duration of the elevations in these frequency ranges is prolonged, however, relative to the normal, and they are interrupted by further peakings. The subsequent decreases in the spectral components precede the syncopal episode. Keywords: blood pressure,
Blutdruck,
Diagramm,
Kipptisch,
tilt table
|
|
|
11868. Szili-Török T;
Gingl Z;
Halmai L;
Kardos A;
Rudas L
Windowed FFT - a time-variant spectral analysis: applicability during the head-up tilt test
Kipptisch
Journal of Clinical and Basic Cardiology 1999; 2 (2): 241-244
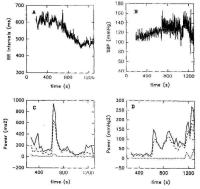
Upright tilt-induced responses of a patient from the tilt-negative group. Panel A. Normal heart rate response to upright tilt. The postural change at 600 s of the recording is accompanied by a certain RR interval shortening. Panel B. Although the fluctuations in systolic BP are augmented following the upright tilt, no clinically significant hypotension is recorded. Panels C and D. Variations in HR (C) and systolic BP (D) powers with time, as assessed
by the windowed FFT method. Solid lines indicate total power, dashed lines indicate LF power, and dotted lines indicate HF power. The upright tilt manoeuvre elicits transient elevations in the LFHRV and TFHRV power. The BP power reveal immediate tilt-related increases in the same spectral bands, followed by subsequent fluctuations of lesser magnitude. The terminal increases in the BPV components are related to the motion artefacts at the time of termination of tilting. Keywords: blood pressure,
Blutdruck,
Diagramm,
heart rate,
Herzfrequenz,
Kipptisch,
tilt table
|
|
|
11869. Kolb H-J;
Böhm U;
Mende M;
Neugebauer A;
Pfeiffer D;
Rother T
Assessment of the optimal atrioventricular delay in patients with dual chamber pacemakers using impedance cardiography and Doppler echocardiography
AV-Intervall
Journal of Clinical and Basic Cardiology 1999; 2 (2): 237-240
Increase in stroke volume (ml) following use of optimal atrioventricular delay at a higher rate DDD stimulation (f = 90 bpm) Keywords: AV-delay,
AV-Intervall,
Diagramm,
Schlaganfallvolumen,
stroke volume
|
|
|
11870. Kolb H-J;
Böhm U;
Mende M;
Neugebauer A;
Pfeiffer D;
Rother T
Assessment of the optimal atrioventricular delay in patients with dual chamber pacemakers using impedance cardiography and Doppler echocardiography
AV-Intervall
Journal of Clinical and Basic Cardiology 1999; 2 (2): 237-240
Increase in stroke volume (ml) following use of optimal atrioventricular delay measured by impedance cardiography at rest (VDD stimulation) Keywords: AV-delay,
AV-Intervall,
Diagramm,
impedance cardiography,
Impedanzkardiographie,
Schlaganfallvolumen,
stroke volume
|
|
|
11871. Kolb H-J;
Böhm U;
Mende M;
Neugebauer A;
Pfeiffer D;
Rother T
Assessment of the optimal atrioventricular delay in patients with dual chamber pacemakers using impedance cardiography and Doppler echocardiography
Echokardiographie - AV-Intervall
Journal of Clinical and Basic Cardiology 1999; 2 (2): 237-240
Pat. H. D. (male, aged 83, DDD pacemaker ELA Chorus 6244 implanted for 2nd degree AV block). Doppler echocardiographic measurement (continuous wave Doppler) of velocity-timeintegral of aortic flow (atrial sensed AVD 141 ms). Keywords: AV-delay,
AV-Intervall,
echocardiography,
Echokardiographie,
ELA Chorus,
ELA Chorus,
pacemaker,
Schrittmacher
|
|
|
11872. Kolb H-J;
Böhm U;
Mende M;
Neugebauer A;
Pfeiffer D;
Rother T
Assessment of the optimal atrioventricular delay in patients with dual chamber pacemakers using impedance cardiography and Doppler echocardiography
Impedanzkardiographie - AV-Intervall
Journal of Clinical and Basic Cardiology 1999; 2 (2): 237-240
Pat. P. S. (male; aged 37, DDD pacemaker Biotronik Logos implanted for 3rd degree AV block). Stroke volume and cardiac output were measured by impedance cardiography at various atrioventricular delays (DDD stimulation, rate 90 bpm). Keywords: AV-delay,
Biotronik,
cardiac index,
cardiac index,
heart rate,
Herzfrequenz,
impedance cardiography,
Impedanzkardiographie,
LOGOS,
LOGOS,
pacemaker,
Schlaganfall,
Schrittmacher,
stroke volume
|
|
|
11873. Salvadori A;
Arreghini M;
Bolla G;
Fanari P;
Giacomotti E;
Longhini E;
Miserocchi G;
Palmulli P
Cardiovascular and adrenergic response to exercise in obese subjects
Epinephrin - Adipositas
Journal of Clinical and Basic Cardiology 1999; 2 (2): 229-236
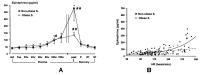
Increments of epinephrine during progressive workloads. * = p < 0.05 normal vs. obese subjects; # = p < 0.05 exercise vs. rest values; ## = p < 0.01 exercise vs. rest values. 9B. Plots of epinephrine vs. HR in non-obese and obese subjects. The regression was exponential for the non-obese subjects: E = exp (1.646 + 0.01 HR) (R²: 0.49; F: 36; MSE: 0.4) and linear for the obese subjects: E= -2.11 + 0.581 HR (R²: 0.23; F: 22; MSE: 900). Keywords: Adipositas,
Belastung,
Diagramm,
Epinephrin,
epinephrine,
exercise,
heart rate,
Herzfrequenz,
Leistung,
obesity,
workload
|
|
|
11874. Salvadori A;
Arreghini M;
Bolla G;
Fanari P;
Giacomotti E;
Longhini E;
Miserocchi G;
Palmulli P
Cardiovascular and adrenergic response to exercise in obese subjects
Herzfrequenz - Systolischer Blutdruck - Adipositas
Journal of Clinical and Basic Cardiology 1999; 2 (2): 229-236
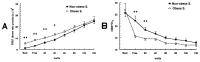
Heart rate systolic pressure product (HRP) plotted vs. mechanical power output in control and obese subjects. B. Ratio of heart rate systolic pressure product to oxygen consumption (HRP/V·O2) plotted vs. mechanical power. Keywords: Adipositas,
Belastung,
Diagramm,
exercise,
heart rate,
Herzfrequenz,
Leistung,
obesity,
systolic blood pressure,
systolischer Blutdruck
|
|
|
11875. Salvadori A;
Arreghini M;
Bolla G;
Fanari P;
Giacomotti E;
Longhini E;
Miserocchi G;
Palmulli P
Cardiovascular and adrenergic response to exercise in obese subjects
Schlaganfall - Sauerstoffverbrauch - Adipositas
Journal of Clinical and Basic Cardiology 1999; 2 (2): 229-236
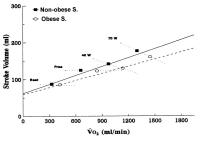
Relationship of stroke volume vs. oxygen consumption (V·O2) in non-obese and obese subjects. The graph reports iso-workload lines. The regression was: Stroke Volume = 0.062 + 0.001 V·O2 - 0.003Z (R²: 0.53; F: 31; MSE: 0.001), with a dummy variable Z = 1 for the obese subjects and 0 for the non-obese subjects. The relationship relative to obese subjects displays statistically similar slopes and a lower intercept compared to controls (p < 0.01). Keywords: Adipositas,
Diagramm,
obesity,
oxygen consumption,
Sauerstoffverbrauch,
Schlaganfall,
stroke
|
|
|
11876. Salvadori A;
Arreghini M;
Bolla G;
Fanari P;
Giacomotti E;
Longhini E;
Miserocchi G;
Palmulli P
Cardiovascular and adrenergic response to exercise in obese subjects
Cardiac Output - Sauerstoffverbrauch - Adipositas
Journal of Clinical and Basic Cardiology 1999; 2 (2): 229-236
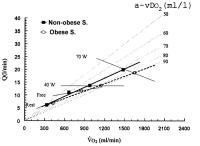
Cardiac output (Q·) vs. oxygen consumption (V·O2) in nonobese and obese subjects with increasing workload. Also shown are iso-workload and iso-arterio-venous oxygen difference lines (a-vDO2).
The regression was: Q· = 2.414 + 0.01 V·O2 + 0.494Z - 0.0021 V·O2Z (R²: 0.83; F: 133; MSE: 4.5), with a dummy variable Z = 1 for the obese and 0 for the non-obese subjects. The regression for obese subjects displays a significantly lower slope compared to controls (p < 0.05). Keywords: Adipositas,
cardiac output,
cardiac output,
Diagramm,
Herzleistung,
obesity,
oxygen consumption,
Sauerstoffverbrauch
|
|
|
11877. Salvadori A;
Arreghini M;
Bolla G;
Fanari P;
Giacomotti E;
Longhini E;
Miserocchi G;
Palmulli P
Cardiovascular and adrenergic response to exercise in obese subjects
Sauerstoffverbrauch - Adipositas
Journal of Clinical and Basic Cardiology 1999; 2 (2): 229-236
Relationship between oxygen consumption, normalised for fat free mass (V·O2/FFM) vs. mechanical power output. ATN and ATO refer to anaerobic threshold for non-obese and obese subjects. *= p < 0.05 Keywords: Adipositas,
Belastung,
Diagramm,
exercise,
Leistung,
obesity,
oxygen consumption,
Sauerstoffverbrauch
|
|
|
11878. Salvadori A;
Arreghini M;
Bolla G;
Fanari P;
Giacomotti E;
Longhini E;
Miserocchi G;
Palmulli P
Cardiovascular and adrenergic response to exercise in obese subjects
Blutfluß - Adipositas
Journal of Clinical and Basic Cardiology 1999; 2 (2): 229-236
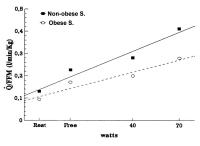
Blood flow per unit body fat-free mass (Q·/FFM) plotted vs. mechanical power output in control and obese subjects. The regression was: Q·/FFM = 0.169 + 0.003 watt - 0.045Z - 0.001 wattZ (R2: 0.69; F: 53; MSE: 0.004), with a dummy variable Z= 1 for the obese subjects and 0 for the non-obese subjects. The regression for obese subjects displays a significantly lower slope compared to controls (p < 0.05). Keywords: Adipositas,
Belastung,
blood flow,
Blutfluss,
Diagramm,
exercise,
Leistung,
obesity
|
|
|
11879. Salvadori A;
Arreghini M;
Bolla G;
Fanari P;
Giacomotti E;
Longhini E;
Miserocchi G;
Palmulli P
Cardiovascular and adrenergic response to exercise in obese subjects
Herzfrequenz - Sauerstoffverbrauch
Journal of Clinical and Basic Cardiology 1999; 2 (2): 229-236
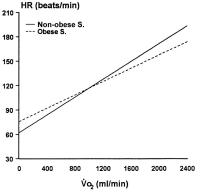
Heart rate (HR) vs. oxygen consumption (V·O2) relationship in non-obese and obese subjects. The regression was: HR = 66.576 + 0.05 V·O2 + 11.44Z + 0.01 V·O2Z (R2: 0.65, F: 93; MSE: 247.6), with a dummy variable Z= 1 for the obese subjects and 0 for the non-obese. The two straight lines have statistically different slopes (p < 0.05). Keywords: Adipositas,
Diagramm,
heart rate,
Herzfrequenz,
obesity,
oxygen consumption,
Sauerstoffverbrauch
|
|
|
11880. Salvadori A;
Arreghini M;
Bolla G;
Fanari P;
Giacomotti E;
Longhini E;
Miserocchi G;
Palmulli P
Cardiovascular and adrenergic response to exercise in obese subjects
Herzfrequenz - Adipositas
Journal of Clinical and Basic Cardiology 1999; 2 (2): 229-236
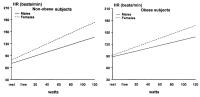
Heart rate (HR) vs. watt relationship in non-obese and obese males and females. The regression lines were: HR = 90.7 + 0.7 watt - 14.2Z2 - 0.2 wattZ2 (R2: 0.8; F: 205; MSE: 248) in the control group, and: HR = 98 + 0.6 watt - 5.8Z2 - 0.2 wattZ2 (R2: 0.8; F: 180; MSE: 145) in the obese group, with a dummy variable Z2 = 1 for males and 0 for females because the two regression lines have significantly different slopes (P < 0.001) Keywords: Adipositas,
Belastung,
Diagramm,
exercise,
heart rate,
Herzfrequenz,
Leistung,
obesity
|
|
|
| |
|

 Suche Medizinische Publikationen
 Suche Abbildungen und Grafiken
 Medizinprodukte - Labortechnik
 Antidotarium (Stand 2012)
 Phytokodex (Stand 2012)
 Fachbücher
 Patientenliteratur