|
|
|---|
1. Manninger-Wünscher M;
Bisping E;
Lercher P;
Prenner G;
Rohrer U;
Sereinigg M;
Zirlik A;
Scherr D
EPU-Corner: Elektrischer Sturm bei WPW-Syndrom
AAI-Stimulation
Journal für Kardiologie - Austrian Journal of Cardiology 2020; 27 (7-8): 302-305
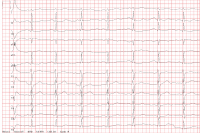
12-Kanal-EKGs unter laufender AAI-Stimulation vor (A) und nach (B) Ablation der beiden akzessorischen Bahnen.
Keywords: AAI-Stimulation,
EKG,
Kardiologie
|
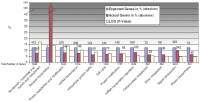
|
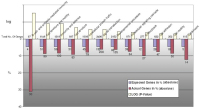
|
2. Manninger-Wünscher M;
Bisping E;
Lercher P;
Prenner G;
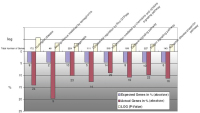
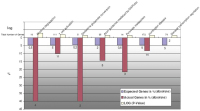
Rohrer U;
Sereinigg M;
Zirlik A;
Scherr D
EPU-Corner: Elektrischer Sturm bei WPW-Syndrom
Ablation
Journal für Kardiologie - Austrian Journal of Cardiology 2020; 27 (7-8): 302-305
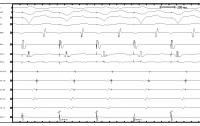
Ablation der links lateralen Bahn führt zu Verlust der Delta-Welle im Oberflächen-EKG (hier V3 und V4) 5 Sekunden nach Start der Ablation. Keywords: Ablation,
EKG,
Kardiologie
|
|
|
3. Manninger-Wünscher M;
Bisping E;
Lercher P;
Prenner G;
Rohrer U;
Sereinigg M;
Zirlik A;
Scherr D
EPU-Corner: Elektrischer Sturm bei WPW-Syndrom
Katheterablation
Journal für Kardiologie - Austrian Journal of Cardiology 2020; 27 (7-8): 302-305
Katheterablation der posteroseptalen (A: RAO, B: LAO) und links lateralen Bahn (C: RAO, D: LAO). Rot: Ablationskatheter; blau: Diagnostikkathe ter im hohen rechten Atrium; gelb: His-Katheter; violett: Diagnostikkatheter im rechten Ventrikel; grün: Diagnostikkatheter im Koronarsinus.
Keywords: Echo,
Kardiologie,
Katheterablation
|
|
|
4. Manninger-Wünscher M;
Bisping E;
Lercher P;
Prenner G;
Rohrer U;
Sereinigg M;
Zirlik A;
Scherr D
EPU-Corner: Elektrischer Sturm bei WPW-Syndrom
FBI-Tachykardie
Journal für Kardiologie - Austrian Journal of Cardiology 2020; 27 (7-8): 302-305
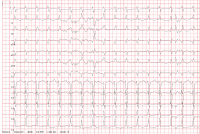
12-Kanal-EKG der FBI-Tachykardie mit minimalen RR-Abständen von bis zu 200 ms. Keywords: EKG,
FBI-Tachykardie,
Kardiologie
|
|
|
5. Manninger-Wünscher M;
Rohrer U;
Toller W;
Maier A;
Theuermann C;
Bisping E;
Lercher P;
Prenner G;
Sereinigg M;
Smolle-Jüttner FM;
Zirlik A;
Scherr D
EPU-Corner: Sympathektomie als Bailout-Therapie bei elektrischem Sturm
Sympathektomie
Journal für Kardiologie - Austrian Journal of Cardiology 2019; 26 (11-12): 332-333
Sympathektomie. Links: thorakoskopischer Zugang; rechts: Darstellung des N. sympathicus vor segmentaler Resektion
(roter Pfeil) Keywords: Kardiologie,
Sympathektomie
|
|
|
6. Manninger-Wünscher M;
Rohrer U;
Toller W;
Maier A;
Theuermann C;
Bisping E;
Lercher P;
Prenner G;
Sereinigg M;
Smolle-Jüttner FM;
Zirlik A;
Scherr D
EPU-Corner: Sympathektomie als Bailout-Therapie bei elektrischem Sturm
Epikardiales Mapping
Journal für Kardiologie - Austrian Journal of Cardiology 2019; 26 (11-12): 332-333
Epikardiales Mapping des linken Ventrikels. Links: modifizierte Ansicht in links lateral; rechts: modifizierte Ansicht in LAO.
Normale Voltage zeigt sich in violett, Narbenareale in rot (Voltage-Cutoff 0,05 mV). Basolateral wurde eine Ablationslinie gesetzt. Keywords: Epikardiales Mapping,
Kardiologie
|
|
|
7. Manninger-Wünscher M;
Rohrer U;
Toller W;
Maier A;
Theuermann C;
Bisping E;
Lercher P;
Prenner G;
Sereinigg M;
Smolle-Jüttner FM;
Zirlik A;
Scherr D
EPU-Corner: Sympathektomie als Bailout-Therapie bei elektrischem Sturm
EKG
Journal für Kardiologie - Austrian Journal of Cardiology 2019; 26 (11-12): 332-333
12-Kanal-EKG der Kammertachykardie. Das EKG
zeigt eine inferiore Achse (positiv in II, III, aVF) sowie eine Transition
in V3. Keywords: EKG,
Kardiologie
|
|
|
8. Zweiker D;
Bisping E;
Lercher P;
Manninger M;
Prenner G;
Riedlbauer R;
Scherr D
EPU-Corner: Incessant WPW-Syndrom
Elektrophysiologische Untersuchung
Journal für Kardiologie - Austrian Journal of Cardiology 2018; 25 (5-6): 148-149
Elektrophysiologische Untersuchung. Es zeigt sich unter Adenosin-Gabe (12 mg i. v.) und rechtsventrikulärer Stimulation eine retrograde ventrikuloatriale Überleitung. Das erste atriale Signal ist bei CS 3/4 sichtbar. Keywords: Adenosin-Gabe,
Elektrophysiologische Untersuchung,
Kardiologie,
rechtsventrikuläre Stimulation,
WPW-Syndrom
|
|
|
9. Zweiker D;
Bisping E;
Lercher P;
Manninger M;
Prenner G;
Riedlbauer R;
Scherr D
EPU-Corner: Incessant WPW-Syndrom
EKG nach Kardioversion
Journal für Kardiologie - Austrian Journal of Cardiology 2018; 25 (5-6): 148-149
Elektrokardiogramm nach elektrischer Kardioversion. Sinusrhythmus, Frequenz 90/min, Steiltyp, PQ-Dauer 140 ms, QRS-Dauer 80 ms, R/S-Umschlag in V5, normale Repolarisation, QT 390ms, QTc 476ms. Keywords: EKG,
Elektrokardiogramm,
Kardiologie,
Kardioversion,
WPW-Syndrom
|
|
|
10. Zweiker D;
Bisping E;
Lercher P;
Manninger M;
Prenner G;
Riedlbauer R;
Scherr D
EPU-Corner: Incessant WPW-Syndrom
EKG bei Aufnahme
Journal für Kardiologie - Austrian Journal of Cardiology 2018; 25 (5-6): 148-149
Elektrokardiogramm bei der Aufnahme auf die Intensivstation. Rhythmische Schmalkomplextachykardie, Frequenz 198/min, Rechtstyp, Fusion der P- und T-Wellen, QRS-Dauer 70 ms, R/S-Umschlag in V5, negative Ts in II, III, aVF, QT 270ms, QTc 402ms. Keywords: Aufnahme,
EKG,
Elektrokardiogramm,
Kardiologie,
WPW-Syndrom
|
|
|
11. Gasser R;
Ablasser K;
Roessl U;
Kraigher-Krainer E;
Lewinski D;
Mangge H;
Mächler H;
Trantina-Yates A;
Tscheliessnigg KH;
Udermann H;
Porta S;
Friehs I;
Scherr E;
Brussee H;
Gasser S
Differential Gene Expression und Nebivolol and Atenolol during Experimental Ischemia in Human Myocardium
Nebivolol - Biological Pathway
Journal of Clinical and Basic Cardiology 2008; 11 (1-4): 16-23
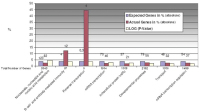
Concerning nebivolol-regulated biological pathways, we could see that, during normoxia, up-regulation of pathways is hardly pronounced by nebivolol over atenolol. This becomes evident also in Figure 9a, only 3
pathways are affected here. Noteworthy here, too, the interleukin signalling pathway. Keywords: Atenolol,
flowchart,
Nebivolol
|
|
|
12. Gasser R;
Ablasser K;
Roessl U;
Kraigher-Krainer E;
Lewinski D;
Mangge H;
Mächler H;
Trantina-Yates A;
Tscheliessnigg KH;
Udermann H;
Porta S;
Friehs I;
Scherr E;
Brussee H;
Gasser S
Differential Gene Expression und Nebivolol and Atenolol during Experimental Ischemia in Human Myocardium
Pathway - Up-Regulation
Journal of Clinical and Basic Cardiology 2008; 11 (1-4): 16-23
Generally, we could see that, during experimental ischemia, upregulation of pathways is minimal by nebivolol over atenolol. This becomes
evident in Figure 9a, only 3 pathways are affected. However, the interleukin signalling pathway may be of interest in connection with inflammation, scarring
and remodelling. Keywords: Atenolol,
flowchart,
ischaemia,
Nebivolol
|
|
|
13. Gasser R;
Ablasser K;
Roessl U;
Kraigher-Krainer E;
Lewinski D;
Mangge H;
Mächler H;
Trantina-Yates A;
Tscheliessnigg KH;
Udermann H;
Porta S;
Friehs I;
Scherr E;
Brussee H;
Gasser S
Differential Gene Expression und Nebivolol and Atenolol during Experimental Ischemia in Human Myocardium
Biological Pathways
Journal of Clinical and Basic Cardiology 2008; 11 (1-4): 16-23
In well-oxygenized preparations, we can see that numerous biological pathways, mainly those involved in signalling, angiogenesis, cellular immunity, and EGF are affected by nebivolol but not by atenolol. Keywords: Atenolol,
biological pathway,
flowchart,
Nebivolol
|
|
|
14. Gasser R;
Ablasser K;
Roessl U;
Kraigher-Krainer E;
Lewinski D;
Mangge H;
Mächler H;
Trantina-Yates A;
Tscheliessnigg KH;
Udermann H;
Porta S;
Friehs I;
Scherr E;
Brussee H;
Gasser S
Differential Gene Expression und Nebivolol and Atenolol during Experimental Ischemia in Human Myocardium
Gene expression
Journal of Clinical and Basic Cardiology 2008; 11 (1-4): 16-23
It is interesting that nebivolol but not atenolol leads to a downregulation of gene expression in glutamine-glutamate conversion and pyruvate
metabolism, the latter of particular interest in ischemia. Keywords: Atenolol,
flowchart,
gene expression,
Nebivolol
|
|
|
15. Gasser R;
Ablasser K;
Roessl U;
Kraigher-Krainer E;
Lewinski D;
Mangge H;
Mächler H;
Trantina-Yates A;
Tscheliessnigg KH;
Udermann H;
Porta S;
Friehs I;
Scherr E;
Brussee H;
Gasser S
Differential Gene Expression und Nebivolol and Atenolol during Experimental Ischemia in Human Myocardium
Well-oxygenized preparations
Journal of Clinical and Basic Cardiology 2008; 11 (1-4): 16-23
In well-oxygenized preparations, we can see that numerous biochemical processes are up-regulated by nebivolol (not by atenolol). Interesting are reverse transcription, stress response, and protein phosphorylation. Keywords: biochemical process,
flowchart
|
|
|
16. Gasser R;
Ablasser K;
Roessl U;
Kraigher-Krainer E;
Lewinski D;
Mangge H;
Mächler H;
Trantina-Yates A;
Tscheliessnigg KH;
Udermann H;
Porta S;
Friehs I;
Scherr E;
Brussee H;
Gasser S
Differential Gene Expression und Nebivolol and Atenolol during Experimental Ischemia in Human Myocardium
Biochemical process
Journal of Clinical and Basic Cardiology 2008; 11 (1-4): 16-23
In well-oxygenized preparations, we can see that numerous biochemical processes, mainly those involved in signalling and cellular immunity, are affected by nebivolol but not by atenolol. In the lower part, we can see that many processes involved in contraction, lipid metabolism, and proliferation are down-regulated by nebivolol only (not by atenolol). This kind of
processes, if slowed down, may render the heart less vulnerable to O2 deficit or ischemia. Keywords: biochemical process,
flowchart
|
|
|
17. Gasser R;
Ablasser K;
Roessl U;
Kraigher-Krainer E;
Lewinski D;
Mangge H;
Mächler H;
Trantina-Yates A;
Tscheliessnigg KH;
Udermann H;
Porta S;
Friehs I;
Scherr E;
Brussee H;
Gasser S
Differential Gene Expression und Nebivolol and Atenolol during Experimental Ischemia in Human Myocardium
Nebivolol - Atenolol
Journal of Clinical and Basic Cardiology 2008; 11 (1-4): 16-23
Similarly, as in Figure 4, biological processes involved in cell-mediated immunity and reverse transcription are significantly up-regulated by nebivolol and not by atenolol. One may deduce that both cellular immunity
as well as reverse transcription are regulated by nebivolol at various sites. Keywords: Atenolol,
flowchart,
Nebivolol
|
|
|
18. Gasser R;
Ablasser K;
Roessl U;
Kraigher-Krainer E;
Lewinski D;
Mangge H;
Mächler H;
Trantina-Yates A;
Tscheliessnigg KH;
Udermann H;
Porta S;
Friehs I;
Scherr E;
Brussee H;
Gasser S
Differential Gene Expression und Nebivolol and Atenolol during Experimental Ischemia in Human Myocardium
Nebivolol - Atenolol
Journal of Clinical and Basic Cardiology 2008; 11 (1-4): 16-23
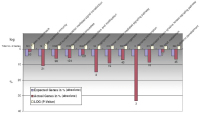
This figure shows biological processes more than twofold downregulated in the presence of nebivolol but unaffected by atenolol during simulated ischemia (100 % O2 replaced by 100 % N2 perfusion). One can
see that, in particular on the level of reverse transcription and T-cell-mediated immunity as well as in the process of angiogenesis, a noteworthy regulation
is brought about by nebivolol. Keywords: Atenolol,
flowchart,
Nebivolol
|
|
|
19. Gasser R;
Ablasser K;
Roessl U;
Kraigher-Krainer E;
Lewinski D;
Mangge H;
Mächler H;
Trantina-Yates A;
Tscheliessnigg KH;
Udermann H;
Porta S;
Friehs I;
Scherr E;
Brussee H;
Gasser S
Differential Gene Expression und Nebivolol and Atenolol during Experimental Ischemia in Human Myocardium
Hypoxia
Journal of Clinical and Basic Cardiology 2008; 11 (1-4): 16-23
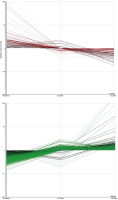
Panels A und B show all genes regulated significantly during experimental myocardial ischemia (hypoxia) in the presence and absence of either atenolol or nebivolol. Panel A (red) summarizes all
genes down-regulated by nebivolol compared to those up-regulated by atenolol during hypoxia. N2 control indicates gene expression in ischemic preparations without betablockers. N2 nebivolol indicates gene expression in the presence of nebivolol in ischemic preparations.
The red and green lines indicate the direction of gene regulation. On the left side of panel A, N2 atenolol represents genes upregulated under atenolol during hypoxia. Panel B, accordingly, shows all genes up-regulated by nebivolol which are down-regulated
by atenolol (N2 control here also representing non-treated controls). Keywords: Atenolol,
hypoxia,
Nebivolol
|
|
|
20. Gasser R;
Ablasser K;
Roessl U;
Kraigher-Krainer E;
Lewinski D;
Mangge H;
Mächler H;
Trantina-Yates A;
Tscheliessnigg KH;
Udermann H;
Porta S;
Friehs I;
Scherr E;
Brussee H;
Gasser S
Differential Gene Expression und Nebivolol and Atenolol during Experimental Ischemia in Human Myocardium
Atenolol - Nebivolol
Journal of Clinical and Basic Cardiology 2008; 11 (1-4): 16-23
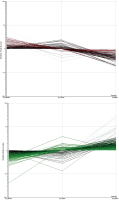
Panels A und B show all genes regulated by either atenolol or nebivolol under non-ischemic, well-oxygenated conditions. Panel
A (red) summarizes all genes down-regulated by nebivolol compared to those up-regulated by atenolol during normoxia. Hence, panel A demonstrates the direct influence of atenolol and nebivolol
on gene expression in well-oxygenated preparations. It can easily be seen that, under optimal conditions, without any sign of ischemia/hypoxia, the effect of nebivolol upon gene expression is quite different
from that of atenolol. O2 control indicates gene expression in well-oxygenated preparations without betablockers. O2 nebivolol indicates gene expression in the presence of nebivolol in non-ischemic,
well-oxygenated preparations. The red and green lines indicate the direction of gene regulation. On the left side of panel A, O2 atenolol represents genes differentially expressed under atenolol during control
conditions. Panel B, accordingly, shows all genes up-regulated by nebivolol which are down-regulated by atenolol (O2 control here also representing untreated controls). Keywords: Atenolol,
Nebivolol
|
|
|
21. Gasser R;
Ablasser K;
Roessl U;
Kraigher-Krainer E;
Lewinski D;
Mangge H;
Mächler H;
Trantina-Yates A;
Tscheliessnigg KH;
Udermann H;
Porta S;
Friehs I;
Scherr E;
Brussee H;
Gasser S
Differential Gene Expression und Nebivolol and Atenolol during Experimental Ischemia in Human Myocardium
Micriarray experiments
Journal of Clinical and Basic Cardiology 2008; 11 (1-4): 16-23
Typical results derived from microarray experiments. Light intensities on the microtiter plate reflect gene expression. Keywords: light intensities
|
|
|
22. Gasser R;
Gasser S;
Ablasser K;
Scherr E;
Roessl U;
Lewinski D;
Mangge H;
Dellacher A;
Mächler H;
Trantina-Yates A;
Tscheliessnigg KH
Quantification of GLUT4 Gene Expression in Human Atrial Myocardium of Hypertensive Patients and the Effect of Experimental Ischaemia Thereupon
Expression of GLUT4
Journal of Clinical and Basic Cardiology 2007; 10 (1-4): 1-6
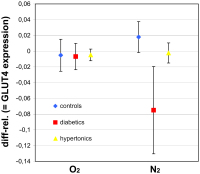
Relative difference in the expression of GLUT4 under ischaemic and non-ischaemic conditions (n = 8; ± SEM) in hypertensive, diabetic and control subjects. Results show slight trends in GLUT4 mRNA expression, however no statistical significance could be seen in either group. Keywords: Diagramm,
flowchart,
GLUT4,
ischaemia,
Ischämie
|
|
|
23. Gasser R;
Gasser S;
Ablasser K;
Scherr E;
Roessl U;
Lewinski D;
Mangge H;
Dellacher A;
Mächler H;
Trantina-Yates A;
Tscheliessnigg KH
Quantification of GLUT4 Gene Expression in Human Atrial Myocardium of Hypertensive Patients and the Effect of Experimental Ischaemia Thereupon
Hypertensive Patients
Journal of Clinical and Basic Cardiology 2007; 10 (1-4): 1-6
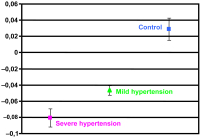
Mean ± SEM of the relative myocardial cellular GLUT4 gene expression in the three tested groups displays clearly the lower GLUT4 expression in hypertensive patients directly snap-frozen during cardiac surgery, not equilibrated with 100 % O2. Keywords: Diagramm,
flowchart,
GLUT4,
hypertension,
Hypertonie
|
|
|
24. Gasser R;
Gasser S;
Ablasser K;
Scherr E;
Roessl U;
Lewinski D;
Mangge H;
Dellacher A;
Mächler H;
Trantina-Yates A;
Tscheliessnigg KH
Quantification of GLUT4 Gene Expression in Human Atrial Myocardium of Hypertensive Patients and the Effect of Experimental Ischaemia Thereupon
GLUT4
Journal of Clinical and Basic Cardiology 2007; 10 (1-4): 1-6
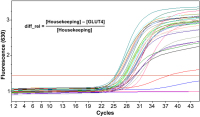
The amount of cycles needed for the amplification curve to exceed the background fluorescence (dashed line) represents the CT value. The quantity of myocardial cellular GLUT4 gene expression is shown as relative difference, which is calculated from the CT values of the housekeeping and the GLUT4 PCR. Keywords: amplification curve,
Amplifikationskurve,
GLUT4
|
|
|
25. Gasser R;
Ablasser K;
Gasser S;
Scherr E;
Toferer E;
Roessl U;
Mächler H;
Trantina-Yates A;
Rigler B;
Tscheliessnigg KH
Letters to the editor: Effects of Nebivolol on Myocardial Gene Expression during N2-stimulated Ischemia in Human Atrial Myocardium
Gene de-regulation
Journal of Clinical and Basic Cardiology 2006; 9 (1-4): 42-44
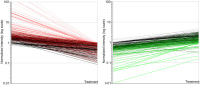
Graphic display of gene de-regulation in myocardial ischemia under nebivolol compared to ischemia under control conditions. One
can clearly see a distinct difference between treatment (right side of each penal) and no-treatment (left side of each penal). Red: genes downregulated under nebivolol, green: genes up-regulated under nebivolol. Keywords: Genderegulation,
gene de-regulation,
Schema,
scheme
|
|
|
26. Gasser R;
Ablasser K;
Gasser S;
Scherr E;
Toferer E;
Roessl U;
Mächler H;
Trantina-Yates A;
Rigler B;
Tscheliessnigg KH
Letters to the editor: Effects of Nebivolol on Myocardial Gene Expression during N2-stimulated Ischemia in Human Atrial Myocardium
Myocardial cellular gene expression
Journal of Clinical and Basic Cardiology 2006; 9 (1-4): 42-44
Myocardial cellular gene-expression significantly up-regulated during experimental ischemia under nebivolol compared to control-ischemia experiments without nebivolol. Yellow bars indicate significance expressed as log p-value: left – highest significance. Keywords: diagram,
Diagramm,
gene expression,
Genexpression
|
|
|
27. Gasser R;
Ablasser K;
Gasser S;
Scherr E;
Toferer E;
Roessl U;
Mächler H;
Trantina-Yates A;
Rigler B;
Tscheliessnigg KH
Letters to the editor: Effects of Nebivolol on Myocardial Gene Expression during N2-stimulated Ischemia in Human Atrial Myocardium
Myocardial cellular gene expression
Journal of Clinical and Basic Cardiology 2006; 9 (1-4): 42-44
Myocardial cellular gene expression significantly down-regulated during experimental ischemia under nebivolol compared to control-ischemia experiments without nebivolol. Yellow bars indicate significance expressed as log p-value: left –
highest significance. Keywords: diagram,
Diagramm,
gene expression,
Genexpression
|
|
|
28. Gasser R;
Ablasser K;
Gasser S;
Scherr E;
Toferer E;
Roessl U;
Kröll K;
Bareza N;
Mächler H;
Trantina-Yates A;
Rigler B;
Tscheliessnigg KH
A Microarray and Real Time PCR Study on the Effect of Experimental Ischemia upon the Expression of the Insulin-Dependent Transmembrane Glucose Transport Molecule GLUT4 in Human Atrial Myocardium
Real Time PCR
Journal of Clinical and Basic Cardiology 2006; 9 (1-4): 4-9
Amplification curves from Real Time PCR performed in human myocardial tissue samples under ischemic and control conditions. Keywords: real time PCR
|
|
|
29. Gasser R;
Ablasser K;
Gasser S;
Scherr E;
Toferer E;
Roessl U;
Kröll K;
Bareza N;
Mächler H;
Trantina-Yates A;
Rigler B;
Tscheliessnigg KH
A Microarray and Real Time PCR Study on the Effect of Experimental Ischemia upon the Expression of the Insulin-Dependent Transmembrane Glucose Transport Molecule GLUT4 in Human Atrial Myocardium
Glut4
Journal of Clinical and Basic Cardiology 2006; 9 (1-4): 4-9
Relative difference in the expression of GLUT4 under ischemic and non-ischemic conditions (n = 8; ± SEM). Results show a trend towards a slight increase in expression, however no statistical significance could be seen. Keywords: GLUT4
|
|
|
30. Gasser R;
Ablasser K;
Gasser S;
Scherr E;
Toferer E;
Roessl U;
Kröll K;
Bareza N;
Mächler H;
Trantina-Yates A;
Rigler B;
Tscheliessnigg KH
A Microarray and Real Time PCR Study on the Effect of Experimental Ischemia upon the Expression of the Insulin-Dependent Transmembrane Glucose Transport Molecule GLUT4 in Human Atrial Myocardium
Ischemia Experiments
Journal of Clinical and Basic Cardiology 2006; 9 (1-4): 4-9
Fluorescent image on 4 pooled ischemia experiments indicating different intensities of fluorescense reflecting expression of 23,401 genes detected. Intensity of fluorescence correlates with the amount of bound cDNA. Keywords: Bypass,
Deutschland,
Diagramm,
fluorescense,
Fluoreszenz,
Gen,
gene,
PCI,
Schweiz,
Österreich
|
|
|
| |

 Suche Medizinische Publikationen
 Suche Abbildungen und Grafiken
 Medizinprodukte - Labortechnik
 Antidotarium (Stand 2012)
 Phytokodex (Stand 2012)
 Fachbücher
 Patientenliteratur